
TABLE OF CONTENTS
Funnel Widget
A Funnel widget is designed to illustrate a step-by-step process in which data gradually funnels from one stage to another. This visualization is commonly employed to monitor the journey of leads or opportunities as they advance through different stages of a conversion or sales funnel.
You can easily switch between various funnels using the dropdown menu provided within the widget.
Please note:
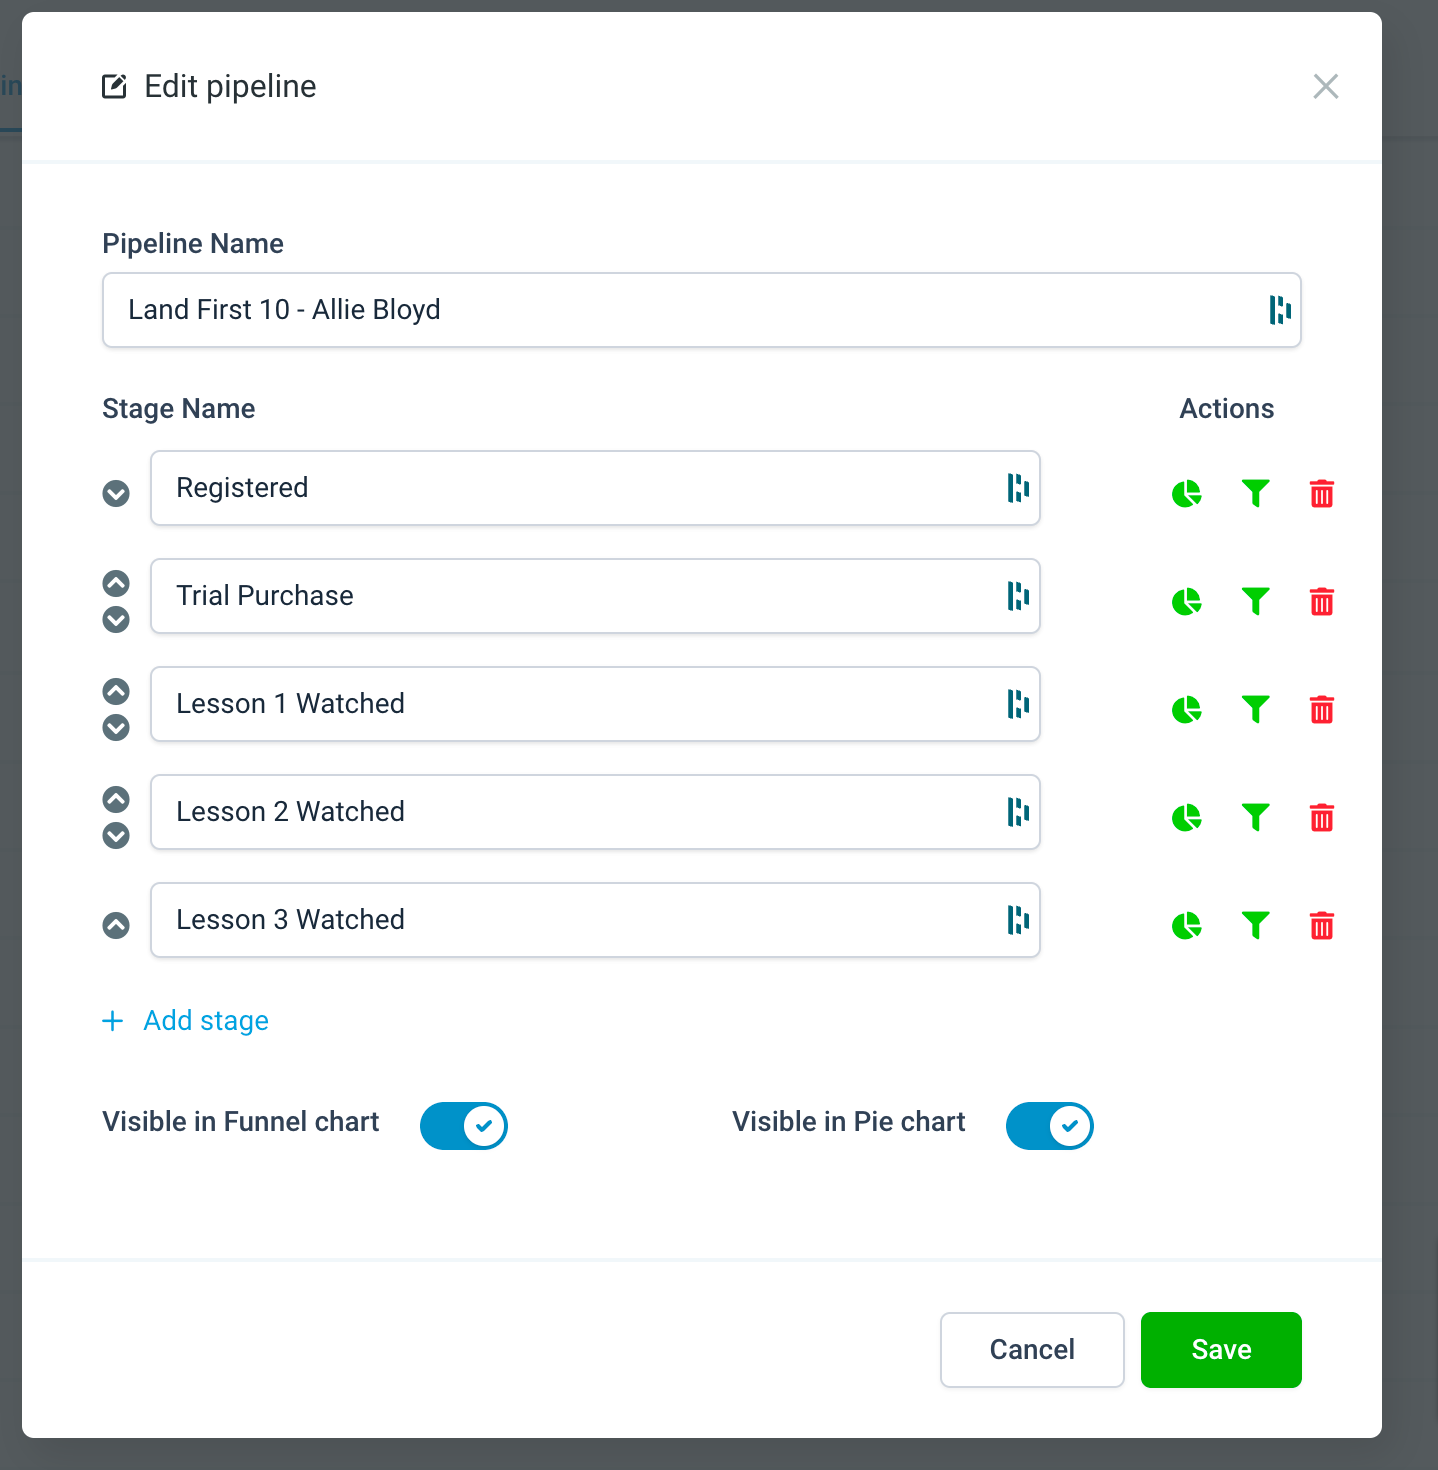
- To access this widget, you need to have Dashboard stats permission enabled. Additionally, for a pipeline to be visible in the Funnel Chart, you must enable the 'Visible in Funnel Chart' toggle within Pipeline Settings.
- The opportunities last_status_change_date is considered while calculating the count in each stage on the chart instead of the "Created" date.
How to interpret Funnel widget data
The funnel widget shows sequential data of the current and the next stages in each section.
For example, Let's assume we have a pipeline with the following stages and data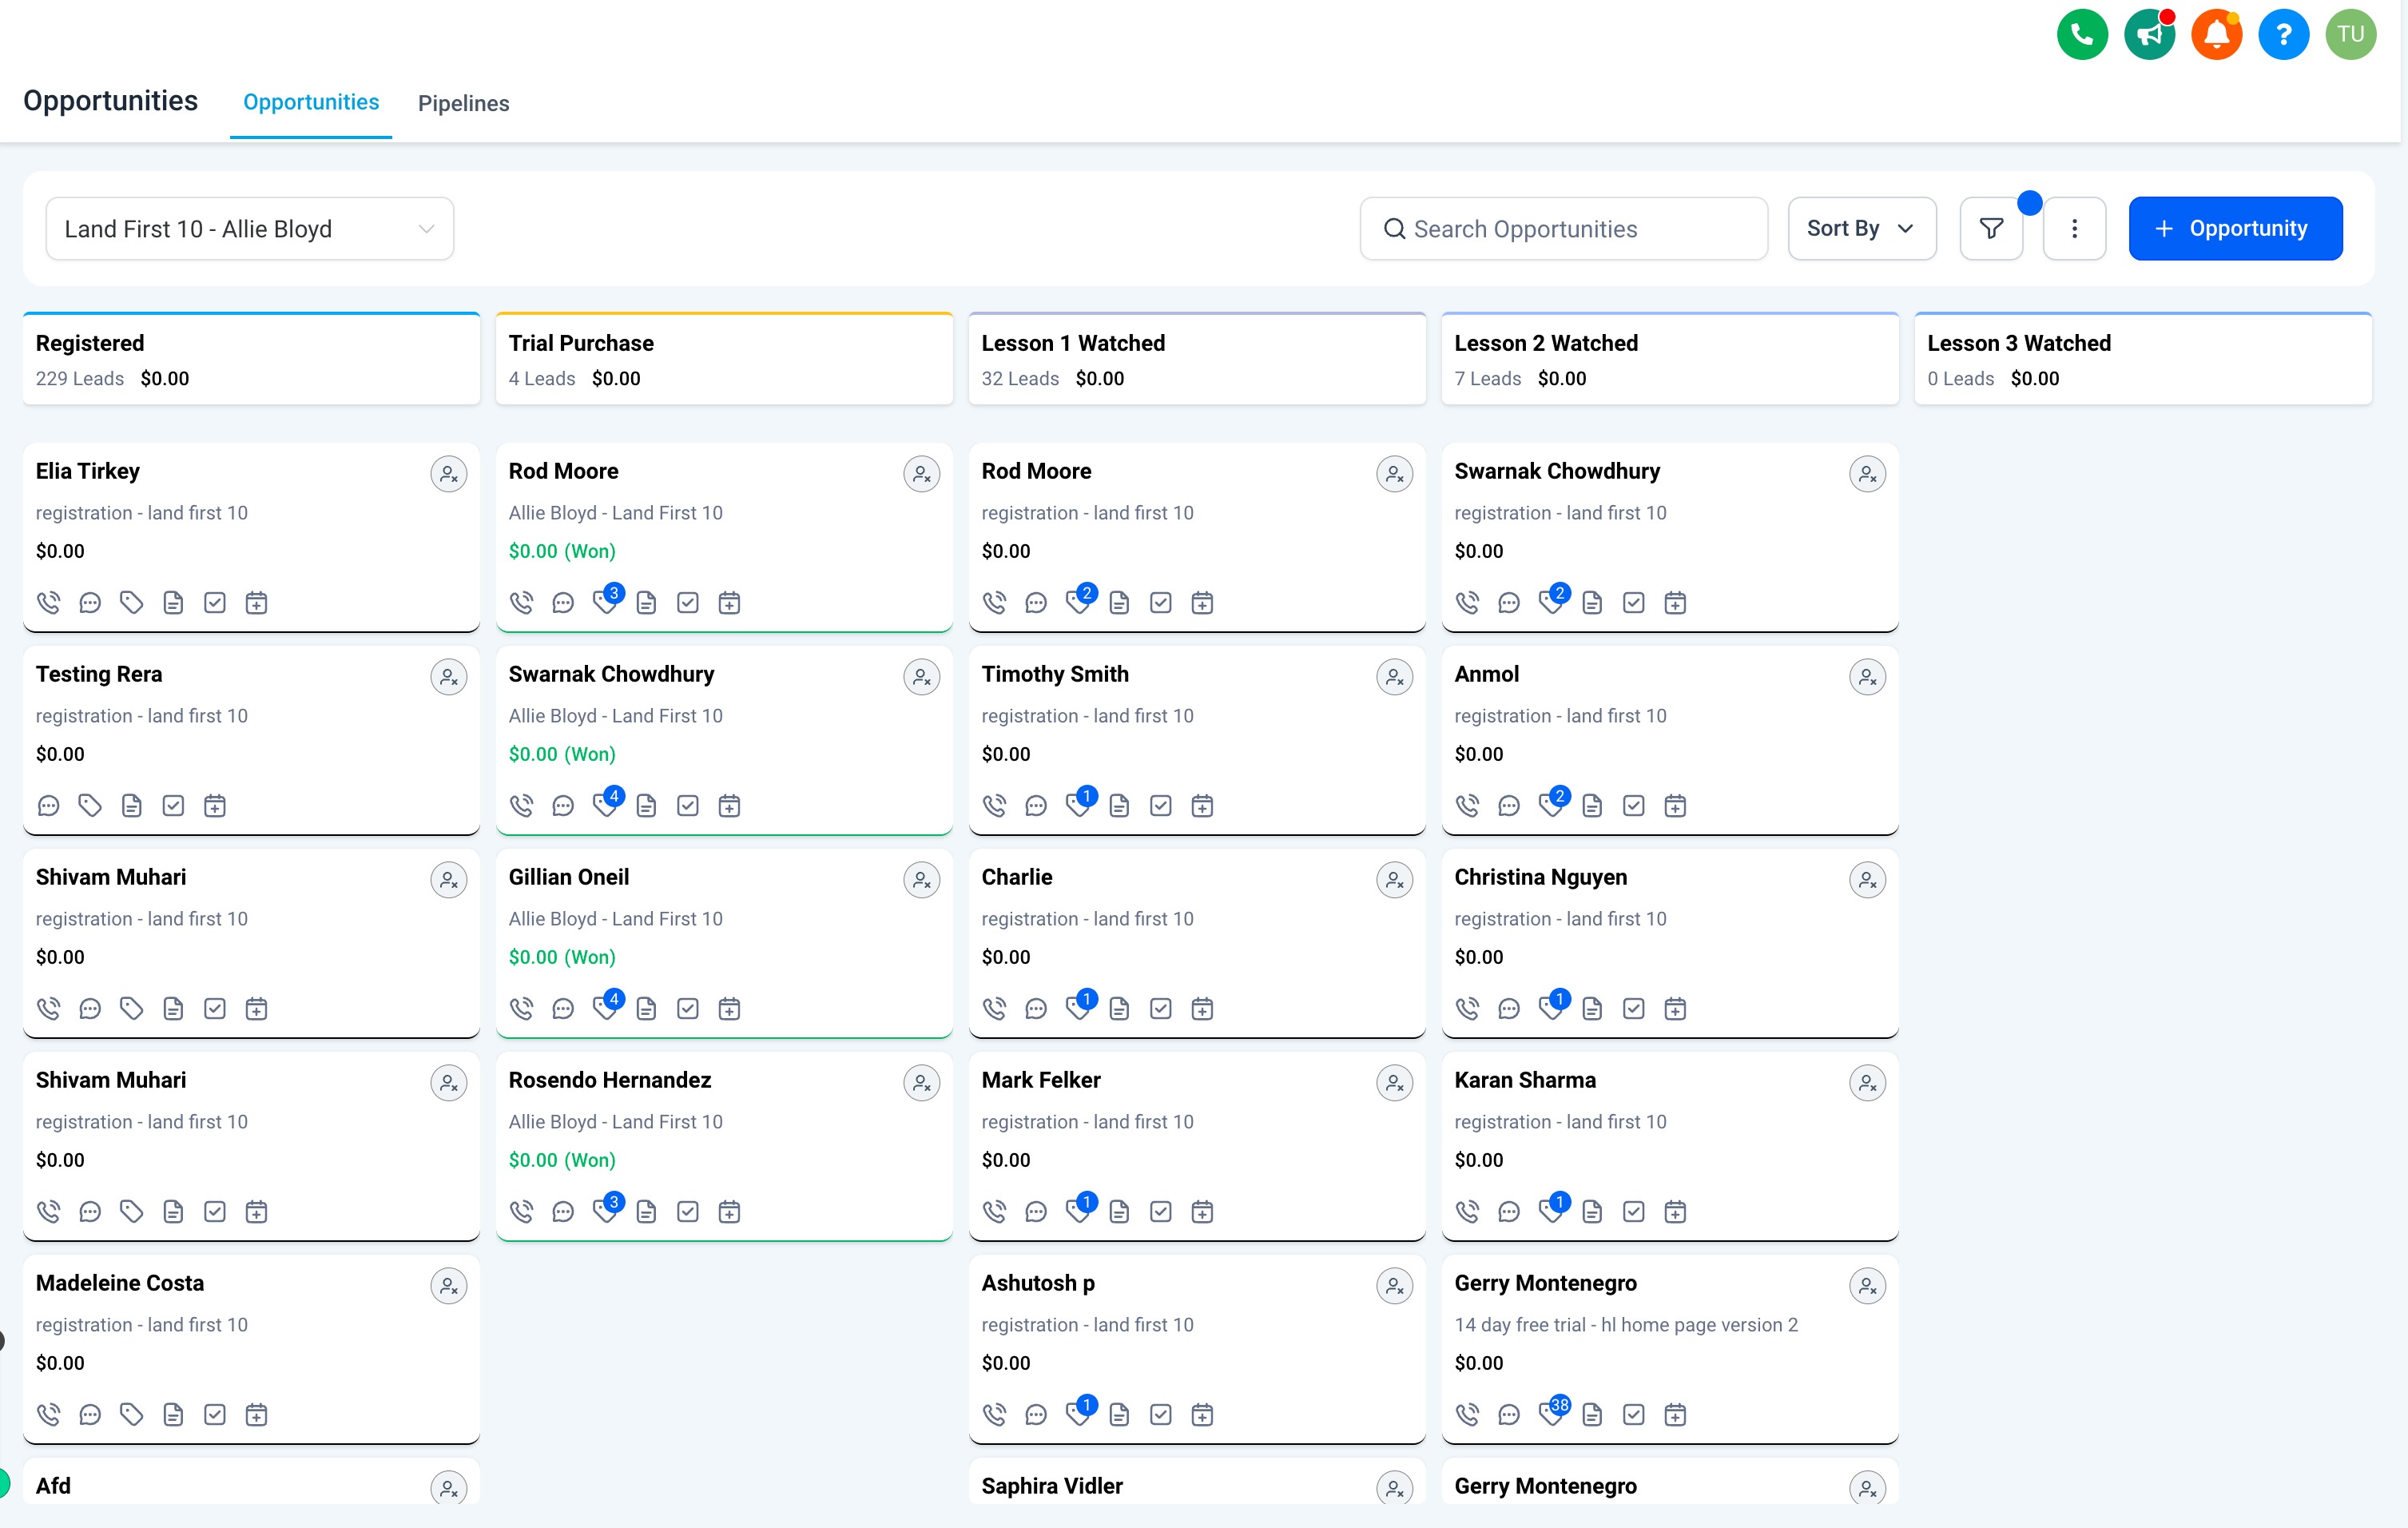
Stage 1: Registered ➝ 229 Leads
Stage 2: Trial Purchased ➝ 4 Leads
Stage 3: Lesson 1 Watched ➝ 32 Leads
Stage 4: Lesson 2 Watched ➝ 7 Leads
Stage 5: Lesson 3 Watched ➝ 0 Leads
Now on the funnel widget, we will see the data as follows
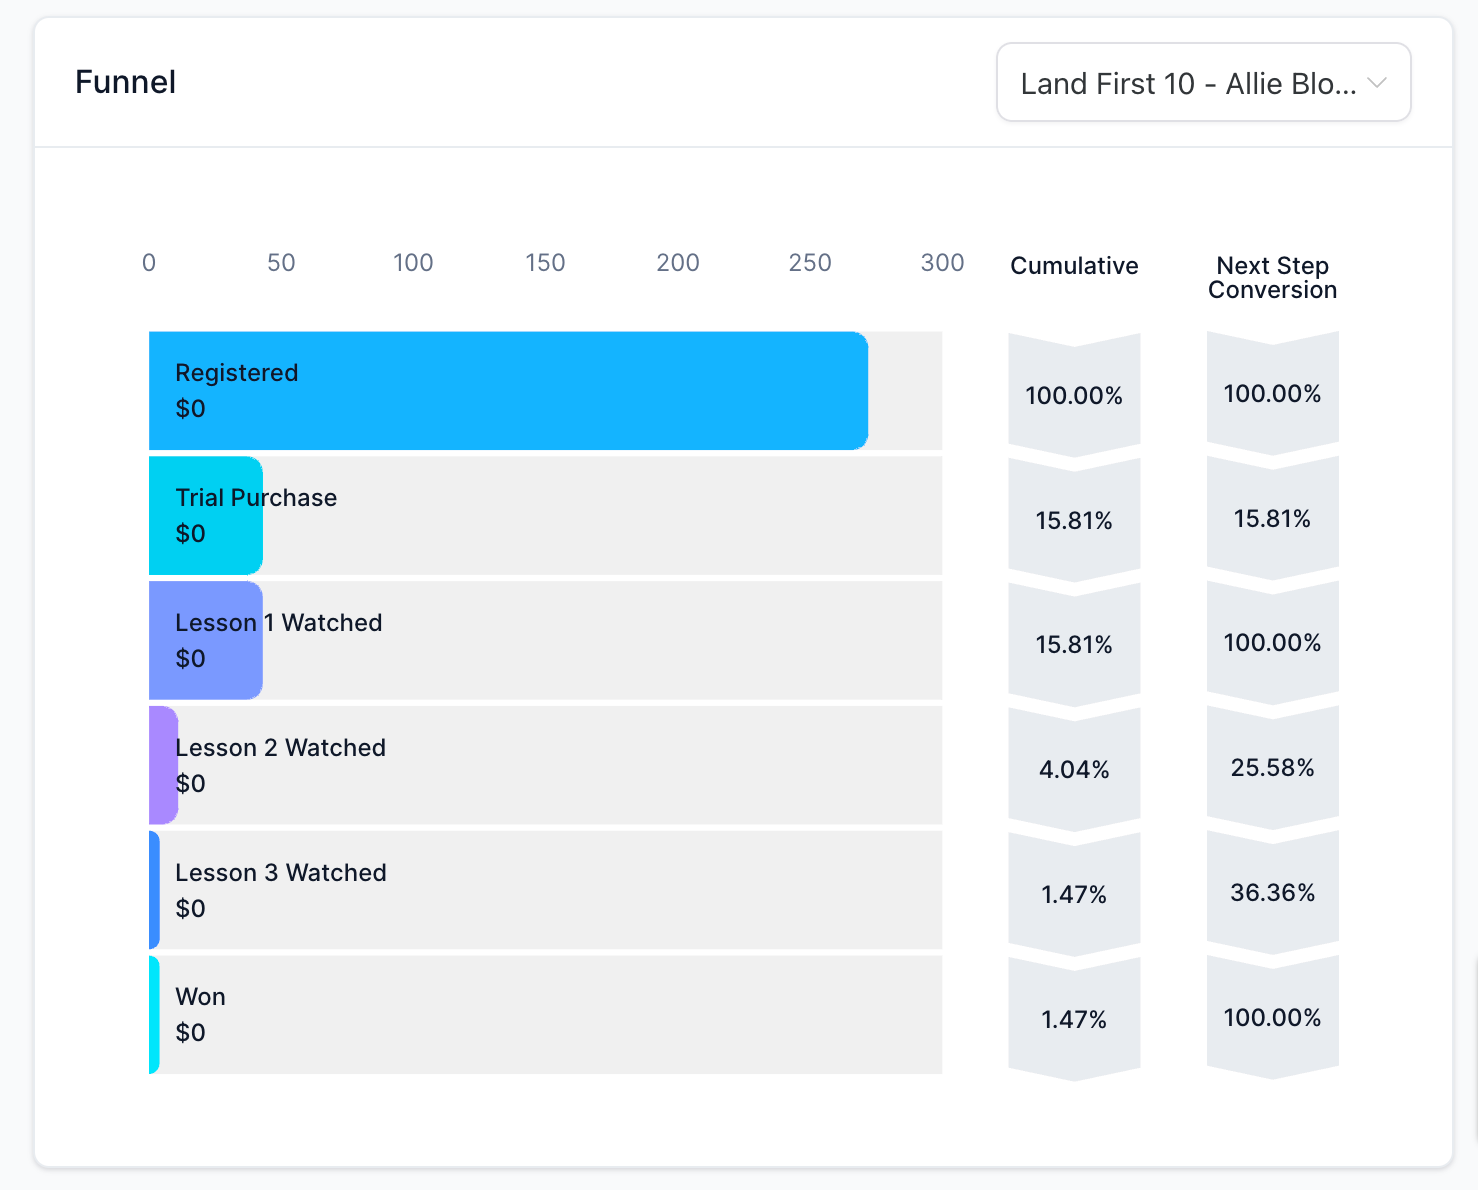
- We will see 6 sections on the widget, 5 for each of our stages and a WON section at the end as it is the desired exit criteria for an opportunity
- The first section (Registered) will show the total number of opportunities that entered the pipeline. In our case, it will show us 272 which is the total opportunities in the pipeline at any stage and with any status (open, lost, won or abandoned)
- In the second section (Trial purchased), we move forward in the stage sequence and remove the opportunities that are still in the previous stage. Here we see 43, which is the total number of opportunities from this stage and onwards, including all WON opportunities in the pipeline
- We always include Total won opportunities in the pipeline in all steps as it is the last step or desired exit criteria for all opportunities
- You can refer to the below formula
Number of opportunities in a section = Number of opportunities from the current stage to the Last stage (including all WON opportunities in the pipeline) - Similarly in the third section, we see 43 opportunities (32 in Lesson 1 Watched + 7 in Lesson 2 Watched + 0 in Lesson 3 Watched + 4 WON opportunities )
- And so on, In the end, you can see the last stage, WON with the final opportunities with WON status
- The cumulative conversion will be for Opportunities that have gone through all of the stages in the Widget, whereas the next step conversion will be specific to the stage above.
- Revenue in each section is calculated similarly in the sequential process for each stage
Stage Distribution Widget
The stage distribution widget shows the number of OPEN opportunities in the individual stage. WON and LOST opportunities are shown separately. The conversion rate is calculated as the % of opportunities converted to the specific stage
You can always switch between different funnels on the widget with the funnel dropdown
Please note:
- Dashboard stats permission needs to be enabled to view this widget and a pipeline can only be viewed by enabling the "Visible in Pie Chart" toggle in Pipeline Settings