More Tutorials from the Community
TABLE OF CONTENTS
Step 1: Add a Widget
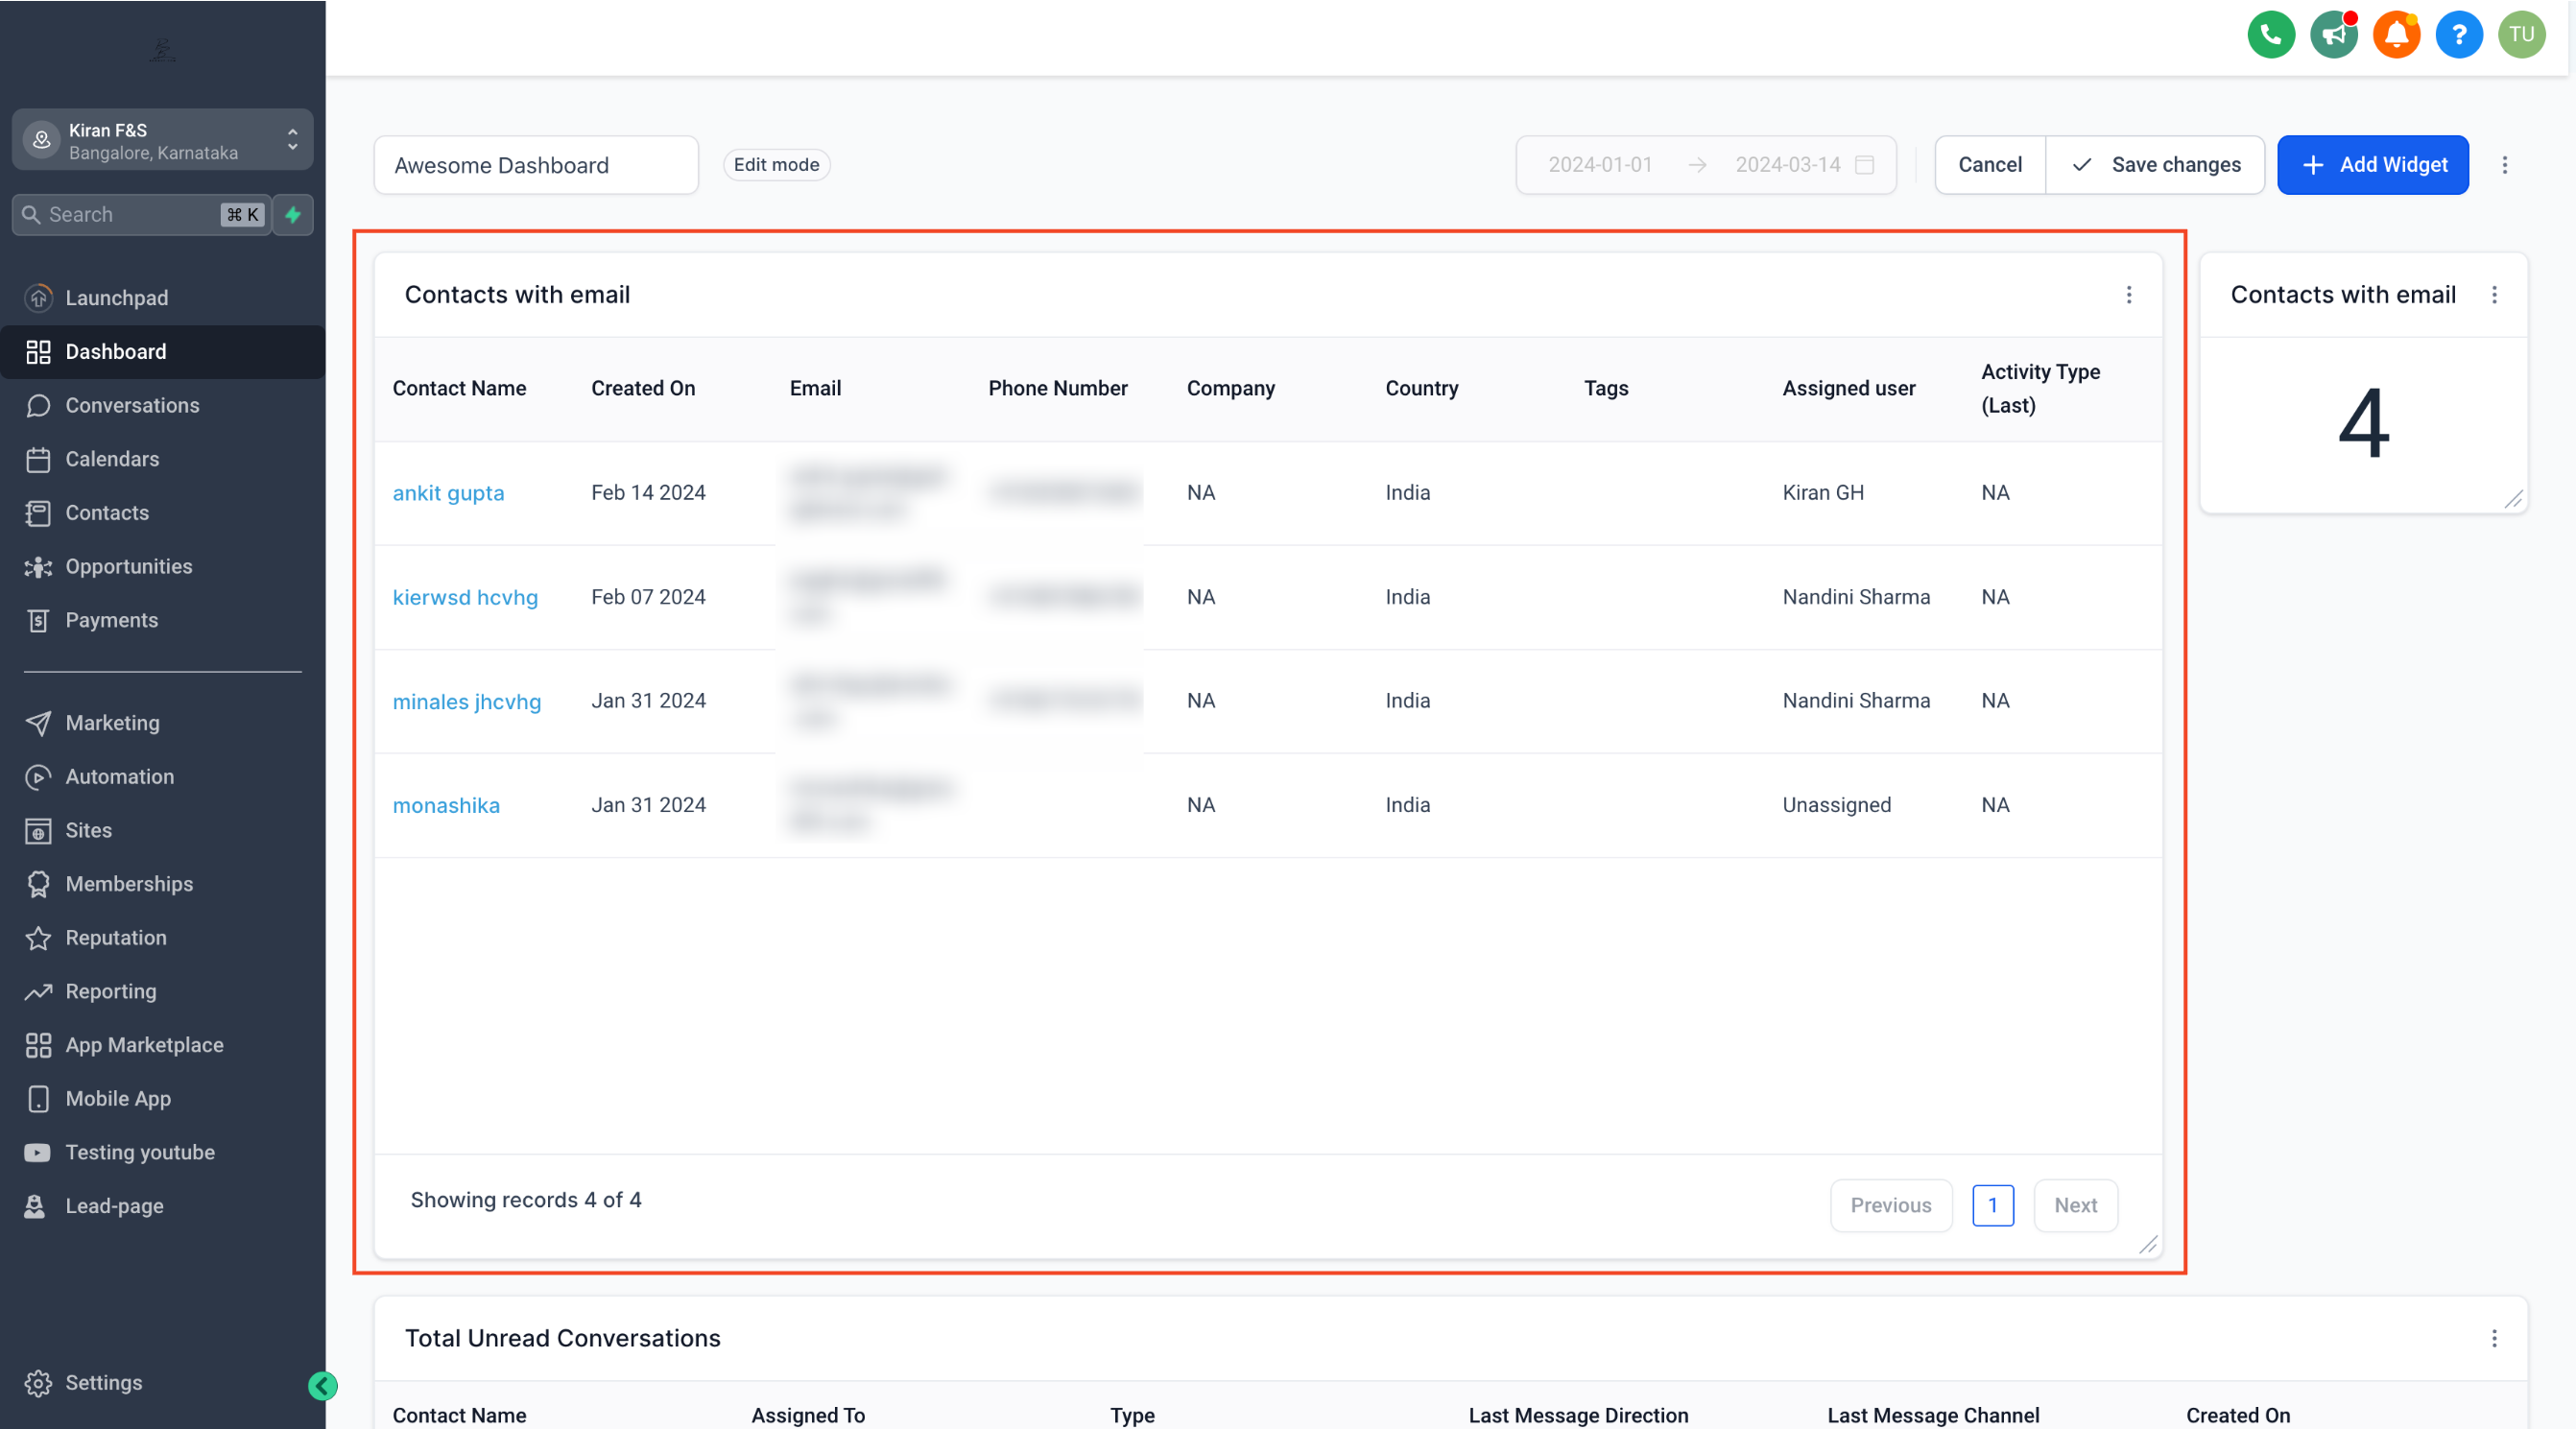
- Go to your dashboard and Click on the edit icon and then Add widget
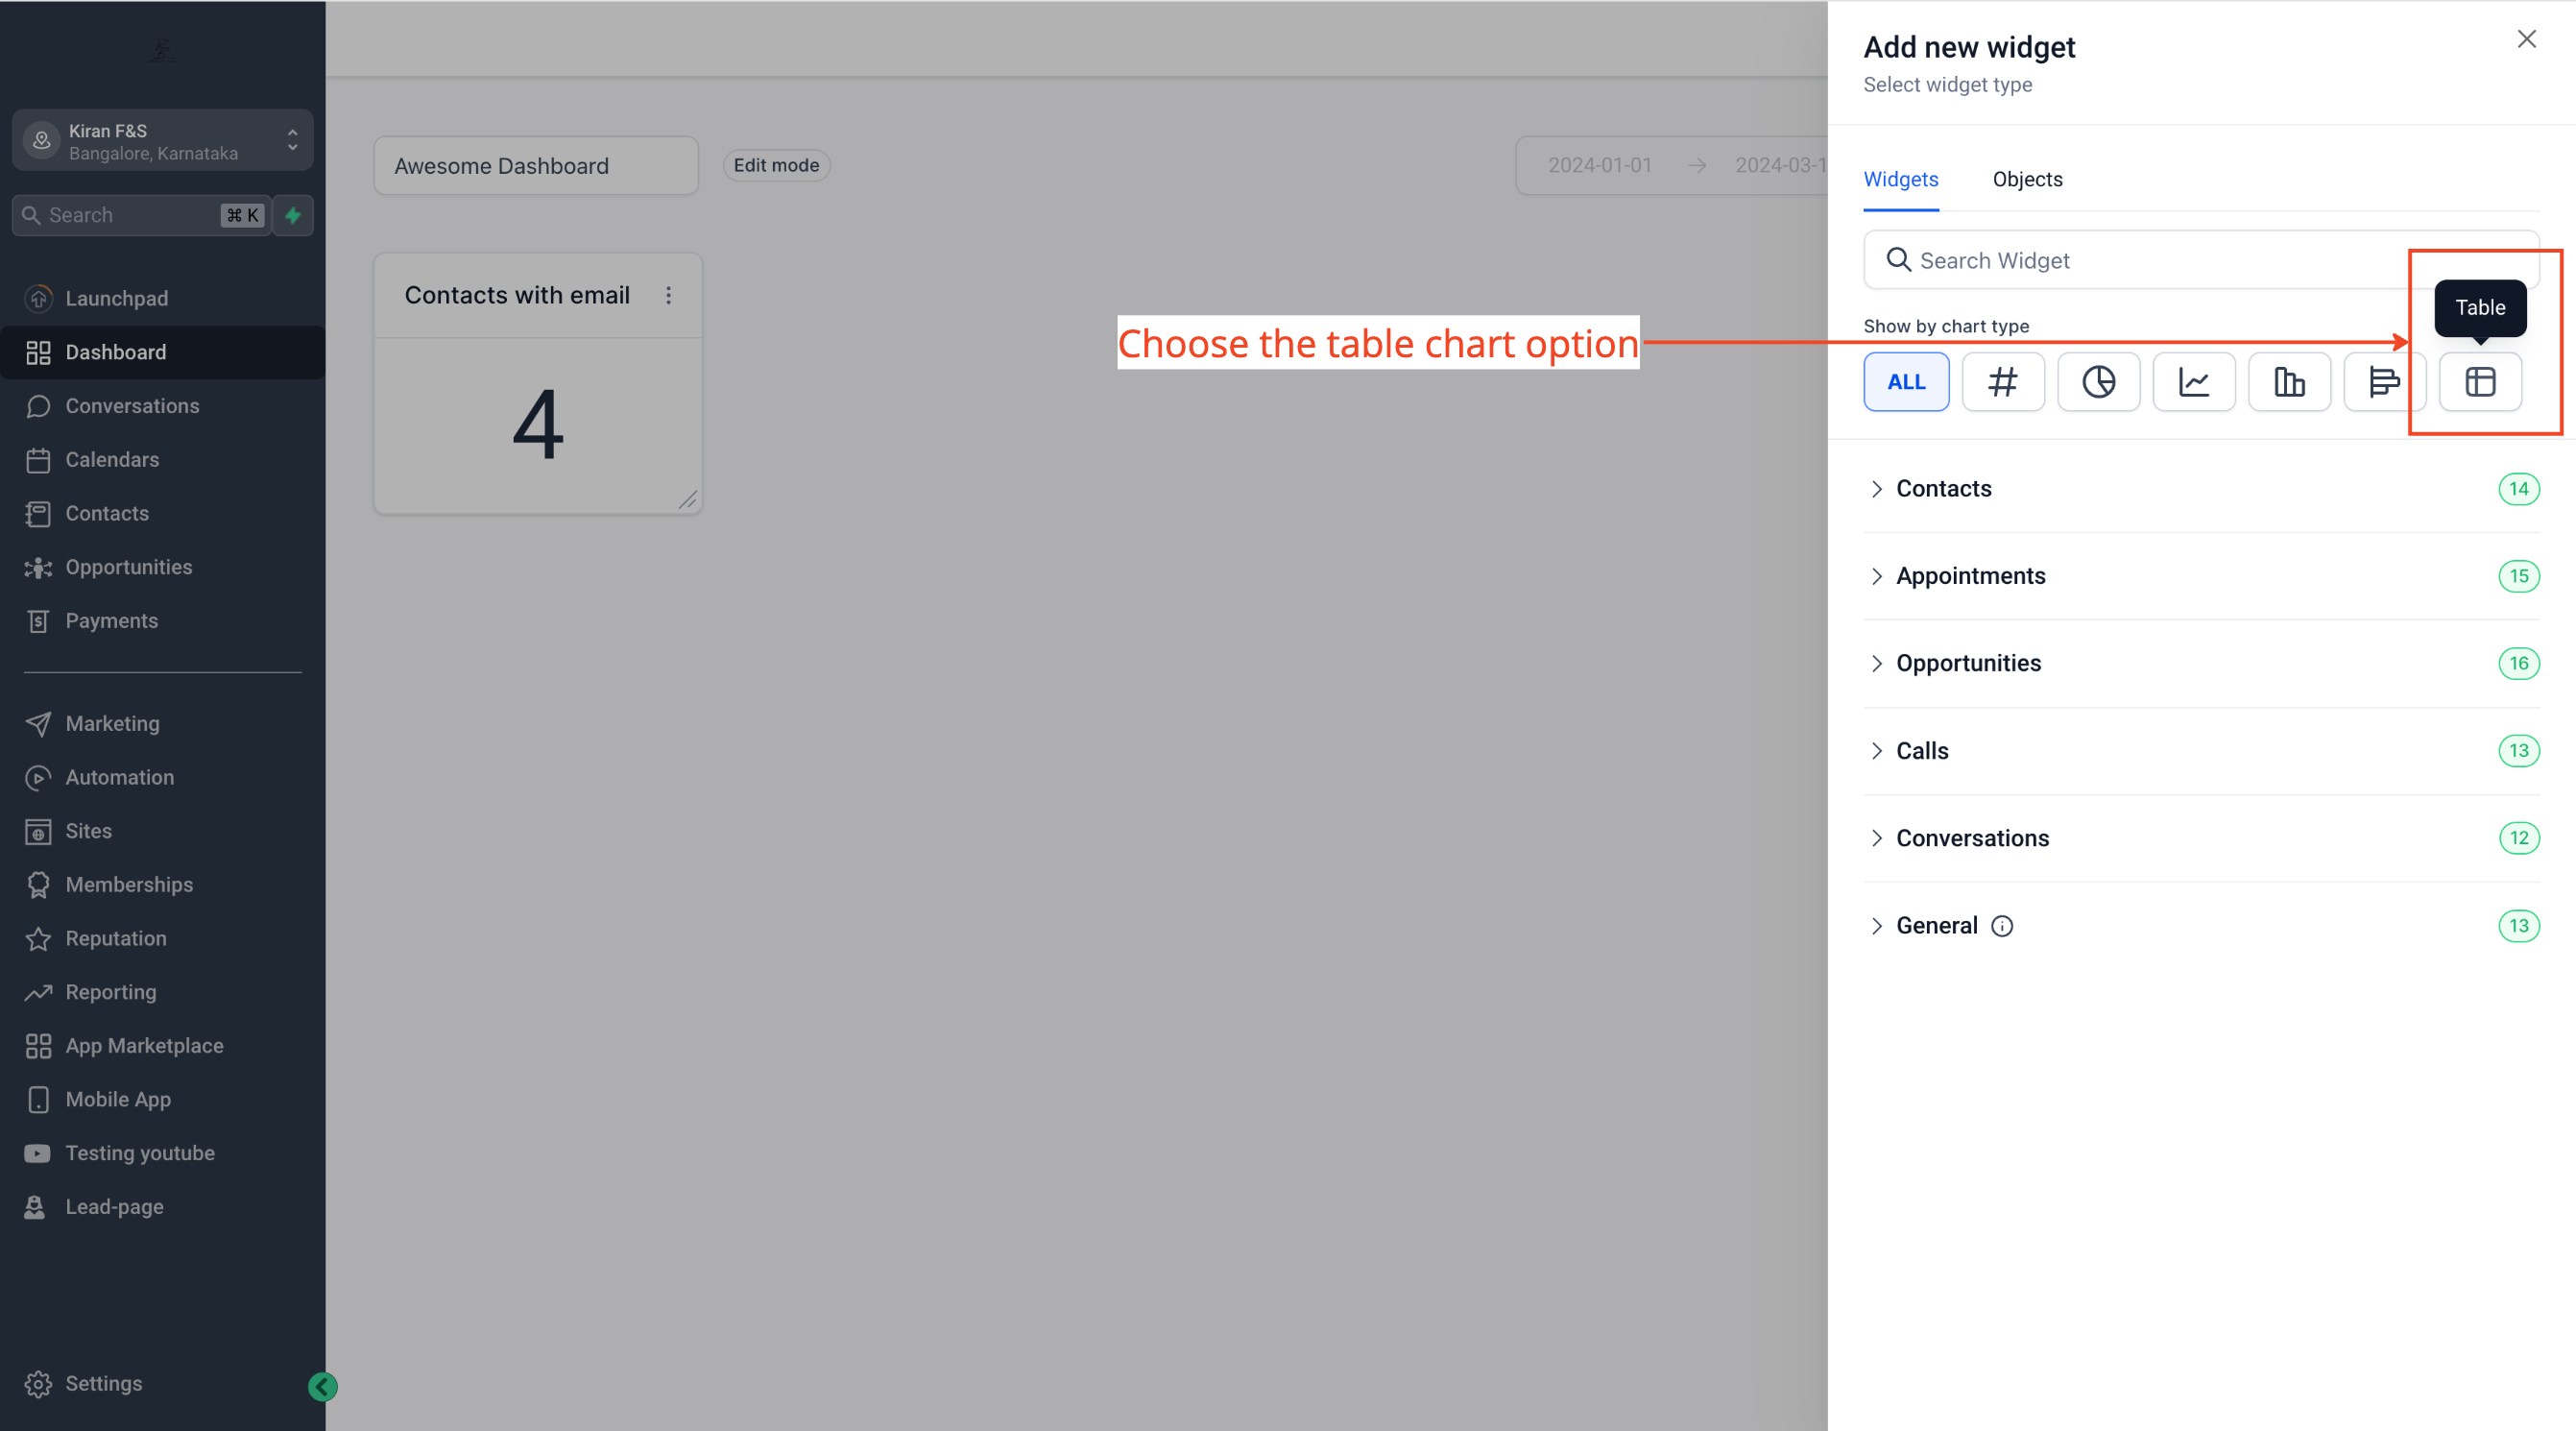
Step 2: Choose Table Chart
- Scroll down to the widget you want to add and change the chart type to table
Step 3: Configure Your Widget
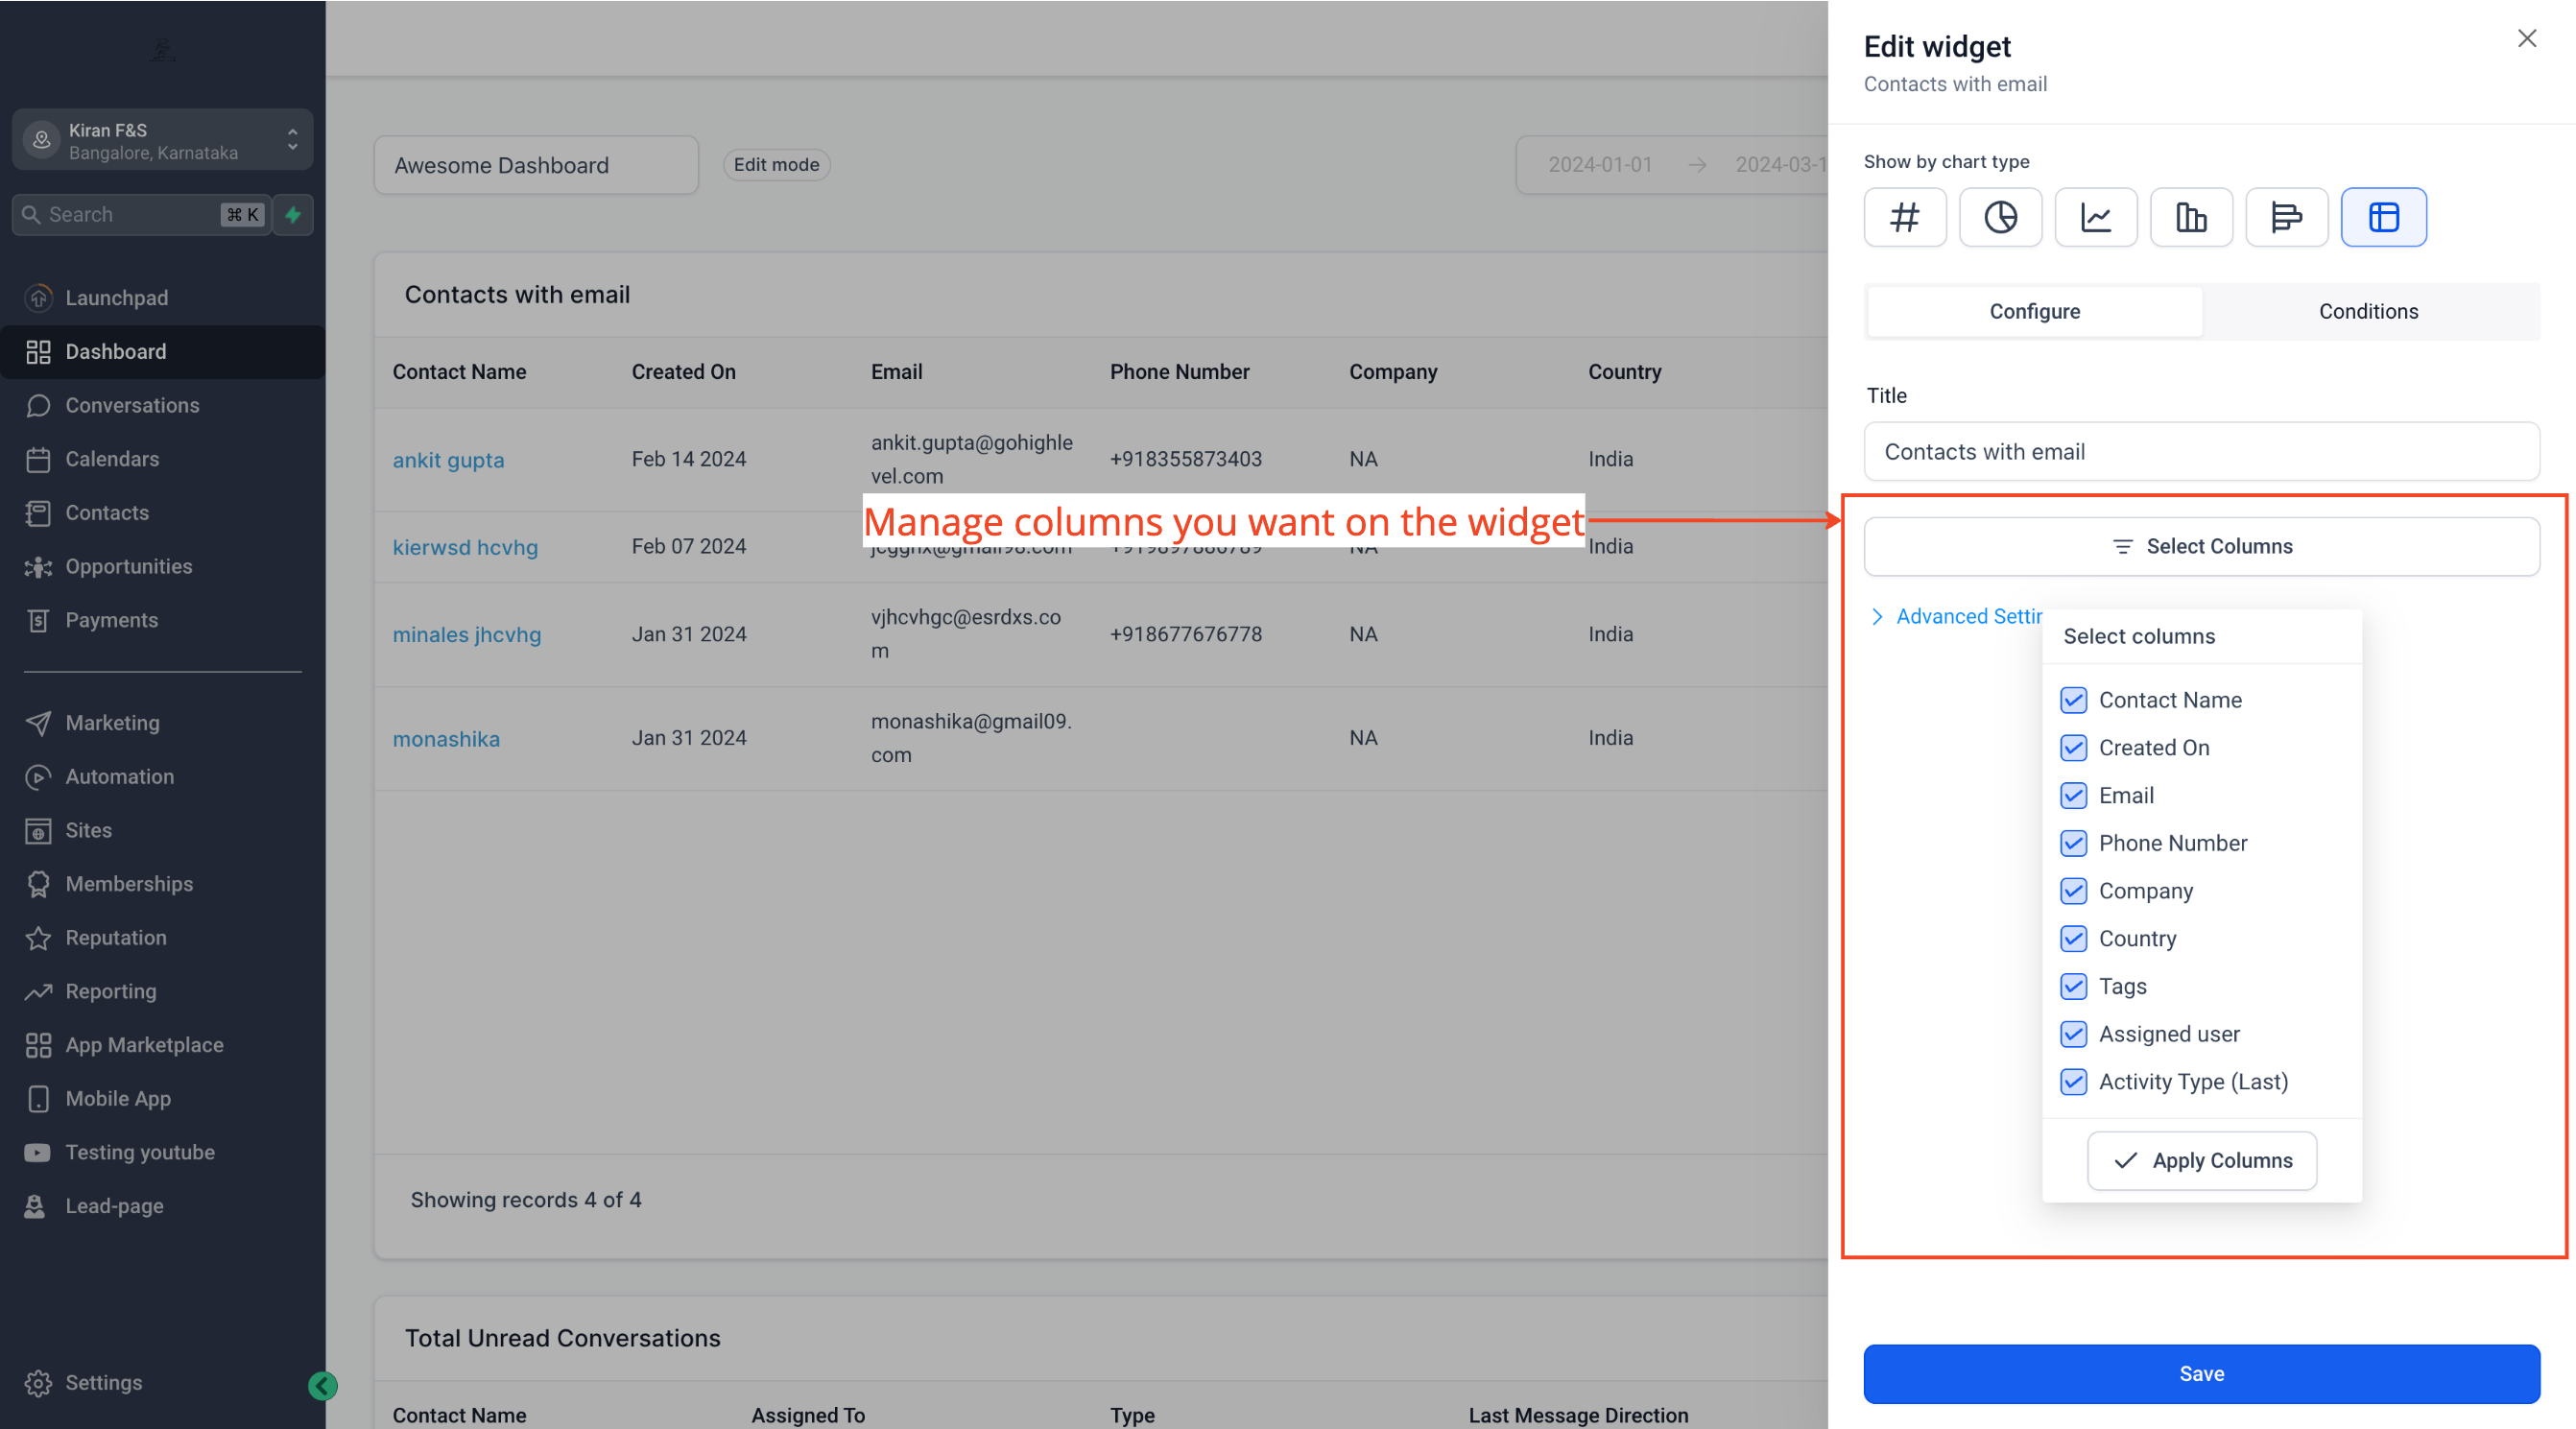
- Click on Select Columns to manage columns you want on your widget
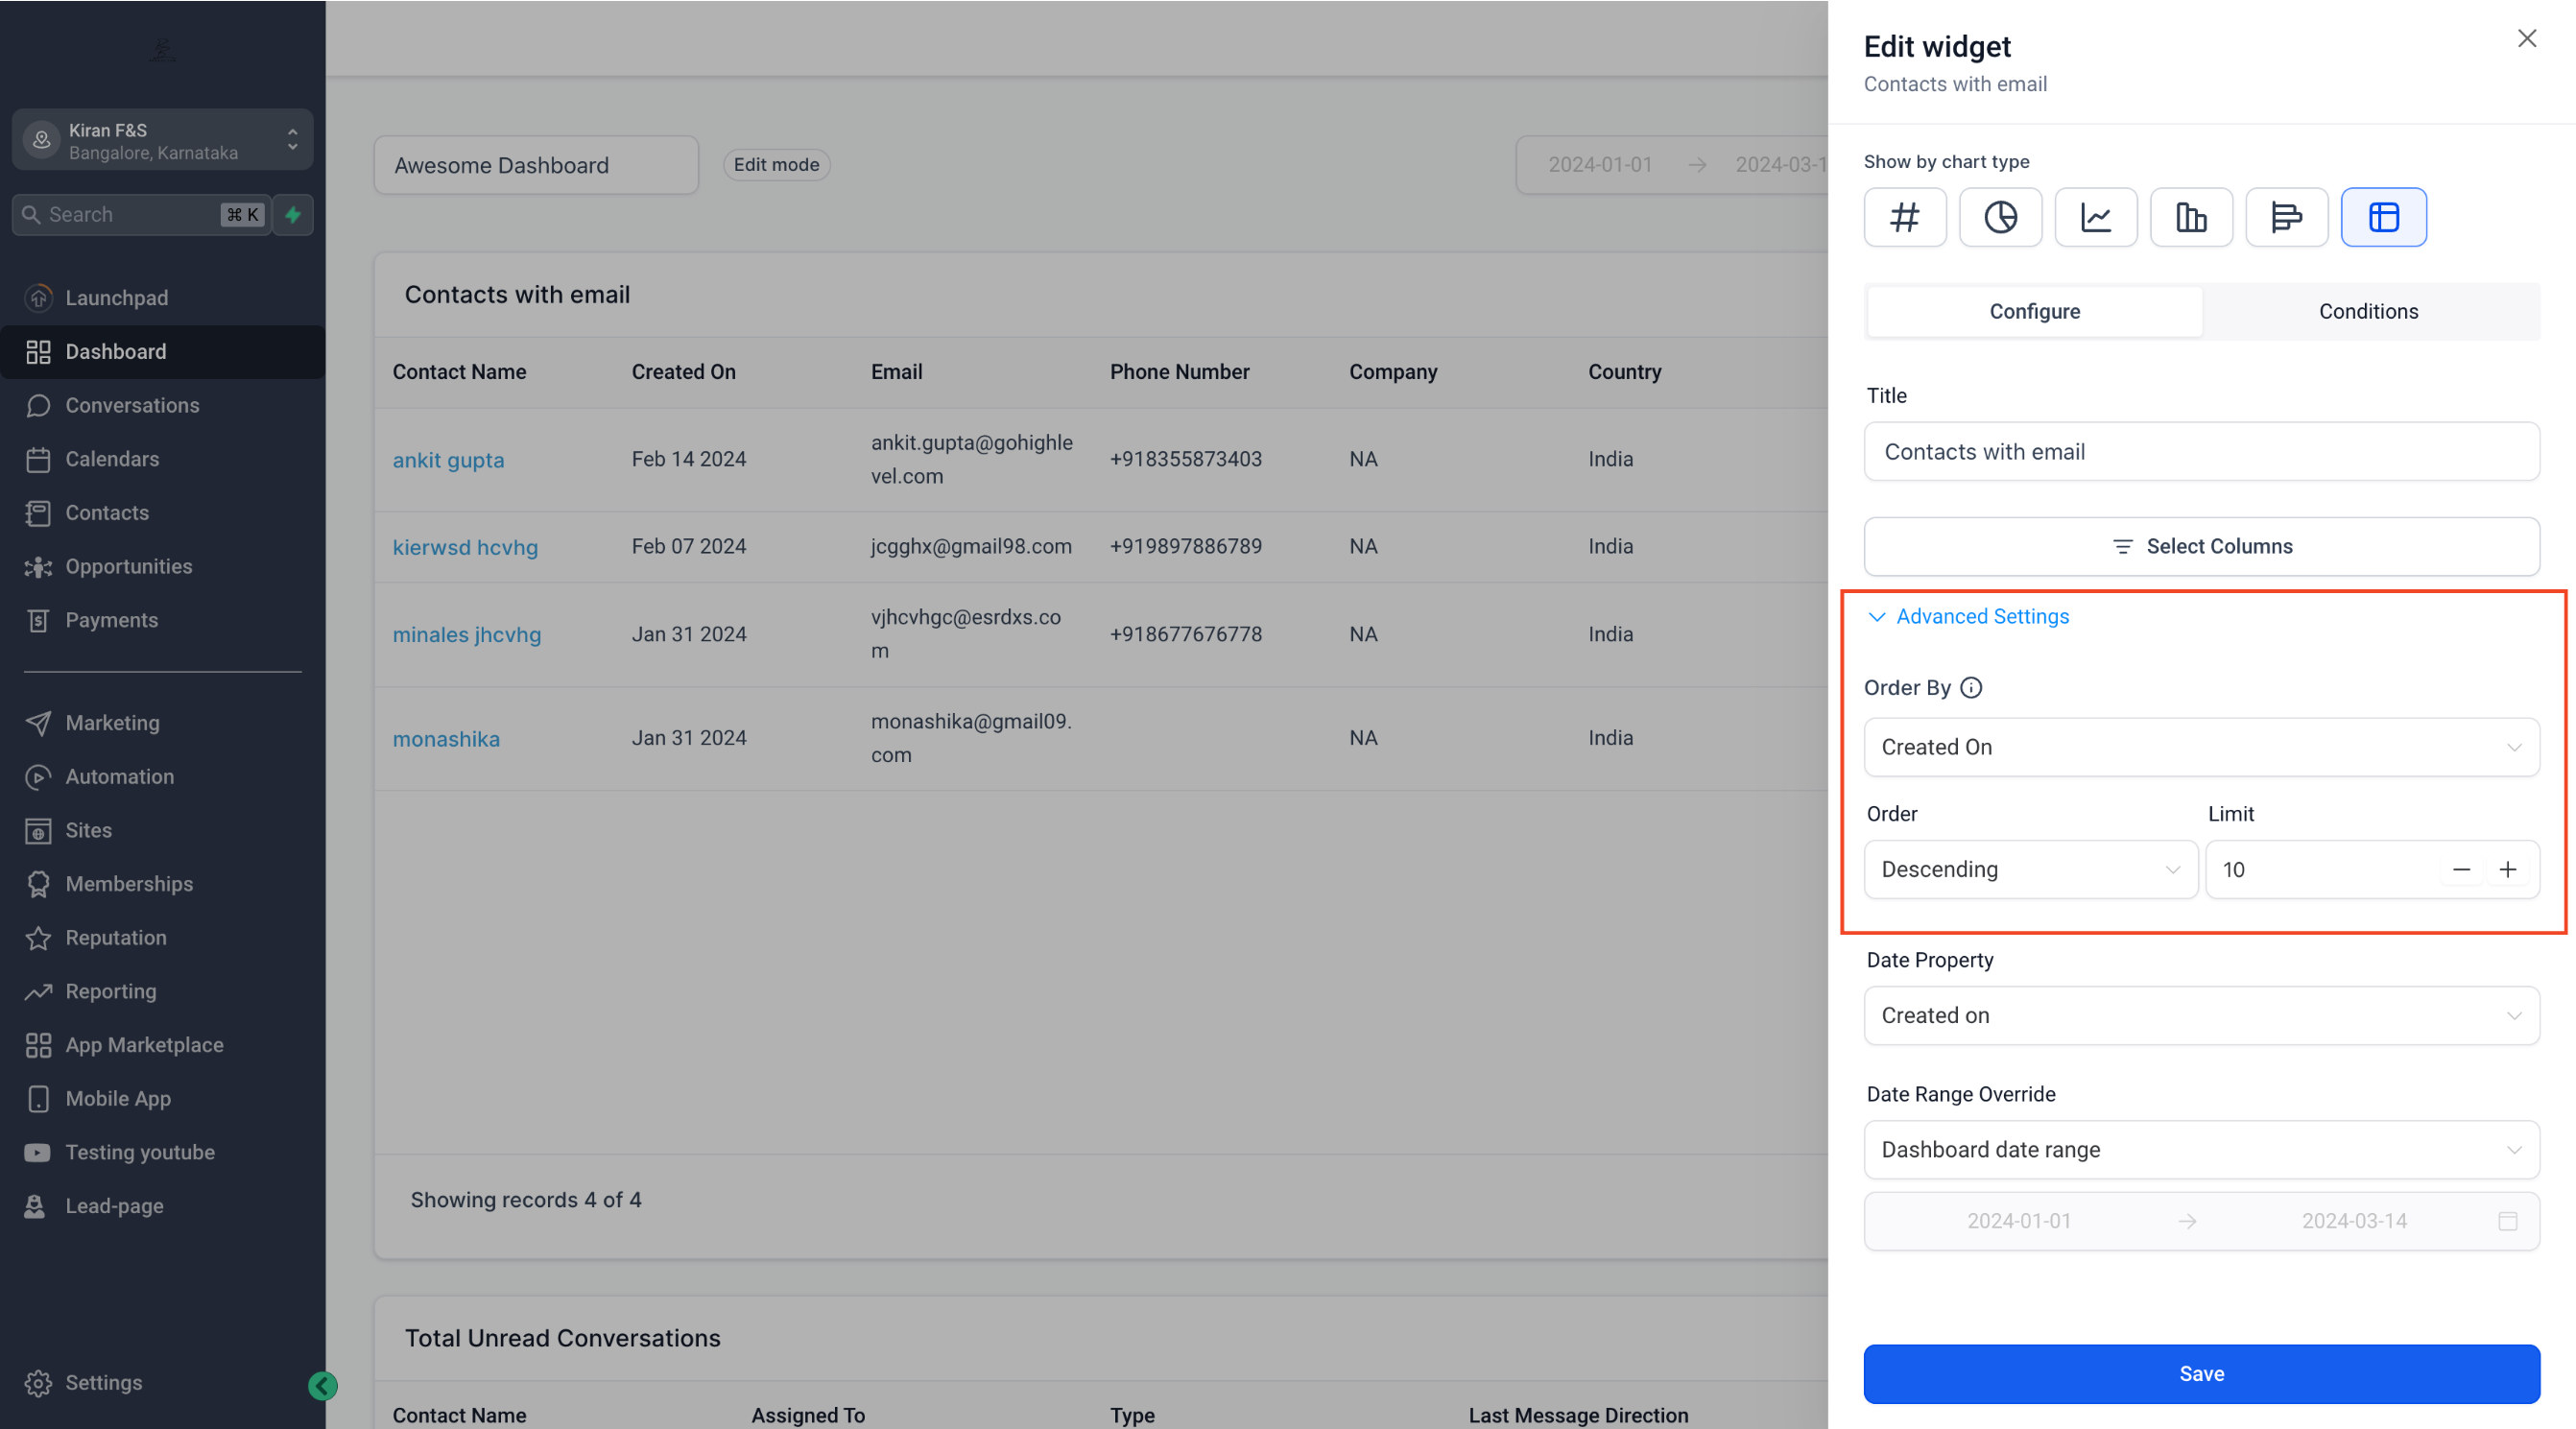
- In Advance Settings, you can choose the column on which you want to order the table
Note (Email Widgets): Source Action Name

In Email Widget table charts, Source Action Name helps you identify what triggered the email.
If the email is associated with a workflow, Source Action Name displays the workflow step name to improve traceability in dashboards and reports.
Step 4: Save Your Changes
- Click on Save to add your widget on the Dashboard