
The Voice AI Agents Dashboard helps you monitor call activity, agent performance, triggered actions, sentiment trends, and call logs from one place. Use the dashboard to understand how Voice AI agents are performing across inbound and outbound calls, compare performance over time, and review logs when you need more detail about specific calls or actions.
TABLE OF CONTENTS
- What is the Voice AI Agents Dashboard?
- Key Benefits of the Voice AI Agents Dashboard
- How To Access Dashboard & Logs
- Dashboard Views: Inbound and Outbound
- Inbound Dashboard Metrics
- Outbound Dashboard Metrics
- Actions Triggered
- Sentiment Analysis
- Comparative Statistics and Percentage Changes
- Filters
- Dashboard Metrics vs. Logs
- Live and Test Call Logs
- How To Use Dashboard Insights
- Frequently Asked Questions
What is the Voice AI Agents Dashboard?
The Voice AI Agents Dashboard provides performance insights for your Voice AI agents. It shows aggregate call metrics, action activity, sentiment trends, and logs so you can review how agents are handling conversations and identify areas that may need improvement.
Use the dashboard to monitor overall trends. Use logs when you need to investigate individual calls, test calls, triggered actions, or specific caller interactions.
Key Benefits of the Voice AI Agents Dashboard
The dashboard gives your team a central place to review Voice AI performance and understand how callers are interacting with your agents. These insights can help you improve prompts, action setup, call routing, and follow-up processes.
- Call performance visibility: Review call volume, completion trends, duration, and call outcomes.
- Inbound and outbound reporting: Switch between inbound and outbound views to understand different call types.
- Action tracking: See how often configured actions are triggered during calls.
- Sentiment insights: Review caller sentiment trends to identify positive, neutral, or negative patterns.
- Agent comparison: Filter by agent to compare performance across different Voice AI agents.
- Call-level investigation: Use logs to review specific live or test calls after identifying a trend.
How To Access Dashboard & Logs
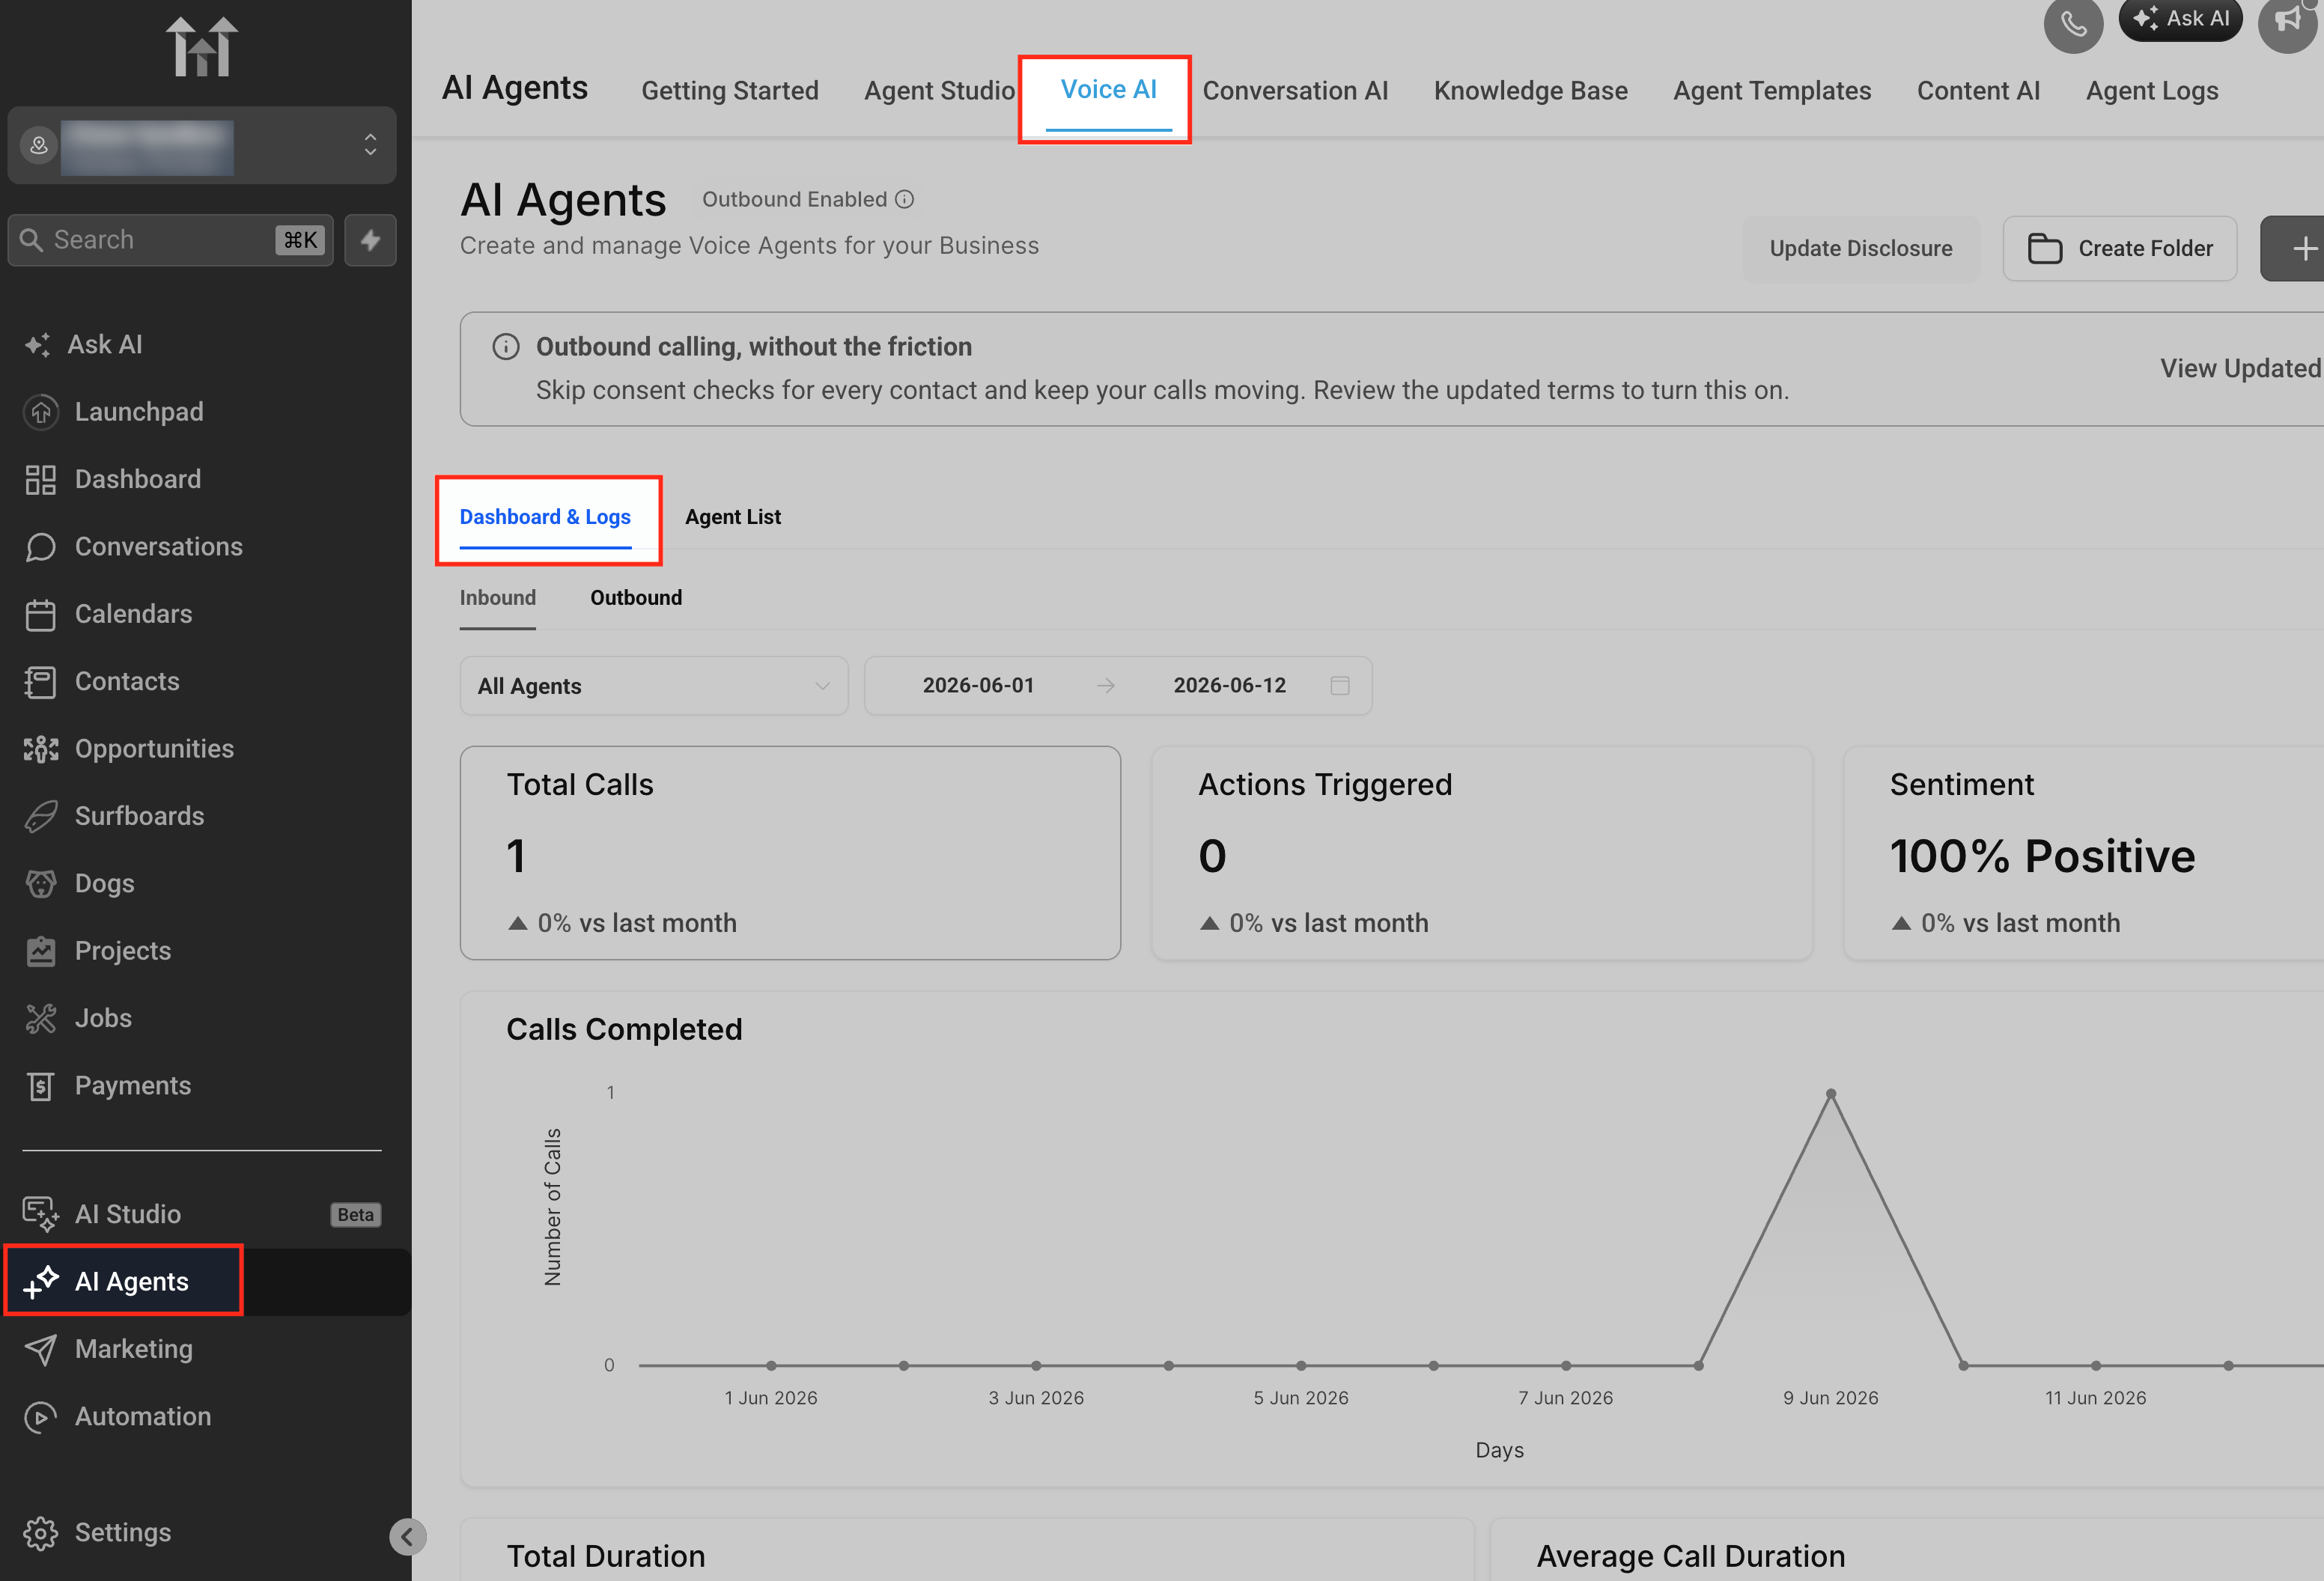
Dashboard & Logs is available from the Voice AI area inside AI Agents. This page lets you move between the agent list and dashboard reporting so you can review performance without opening each agent individually.
- Go to AI Agents.
- Select Voice AI.
- Click Dashboard & Logs.
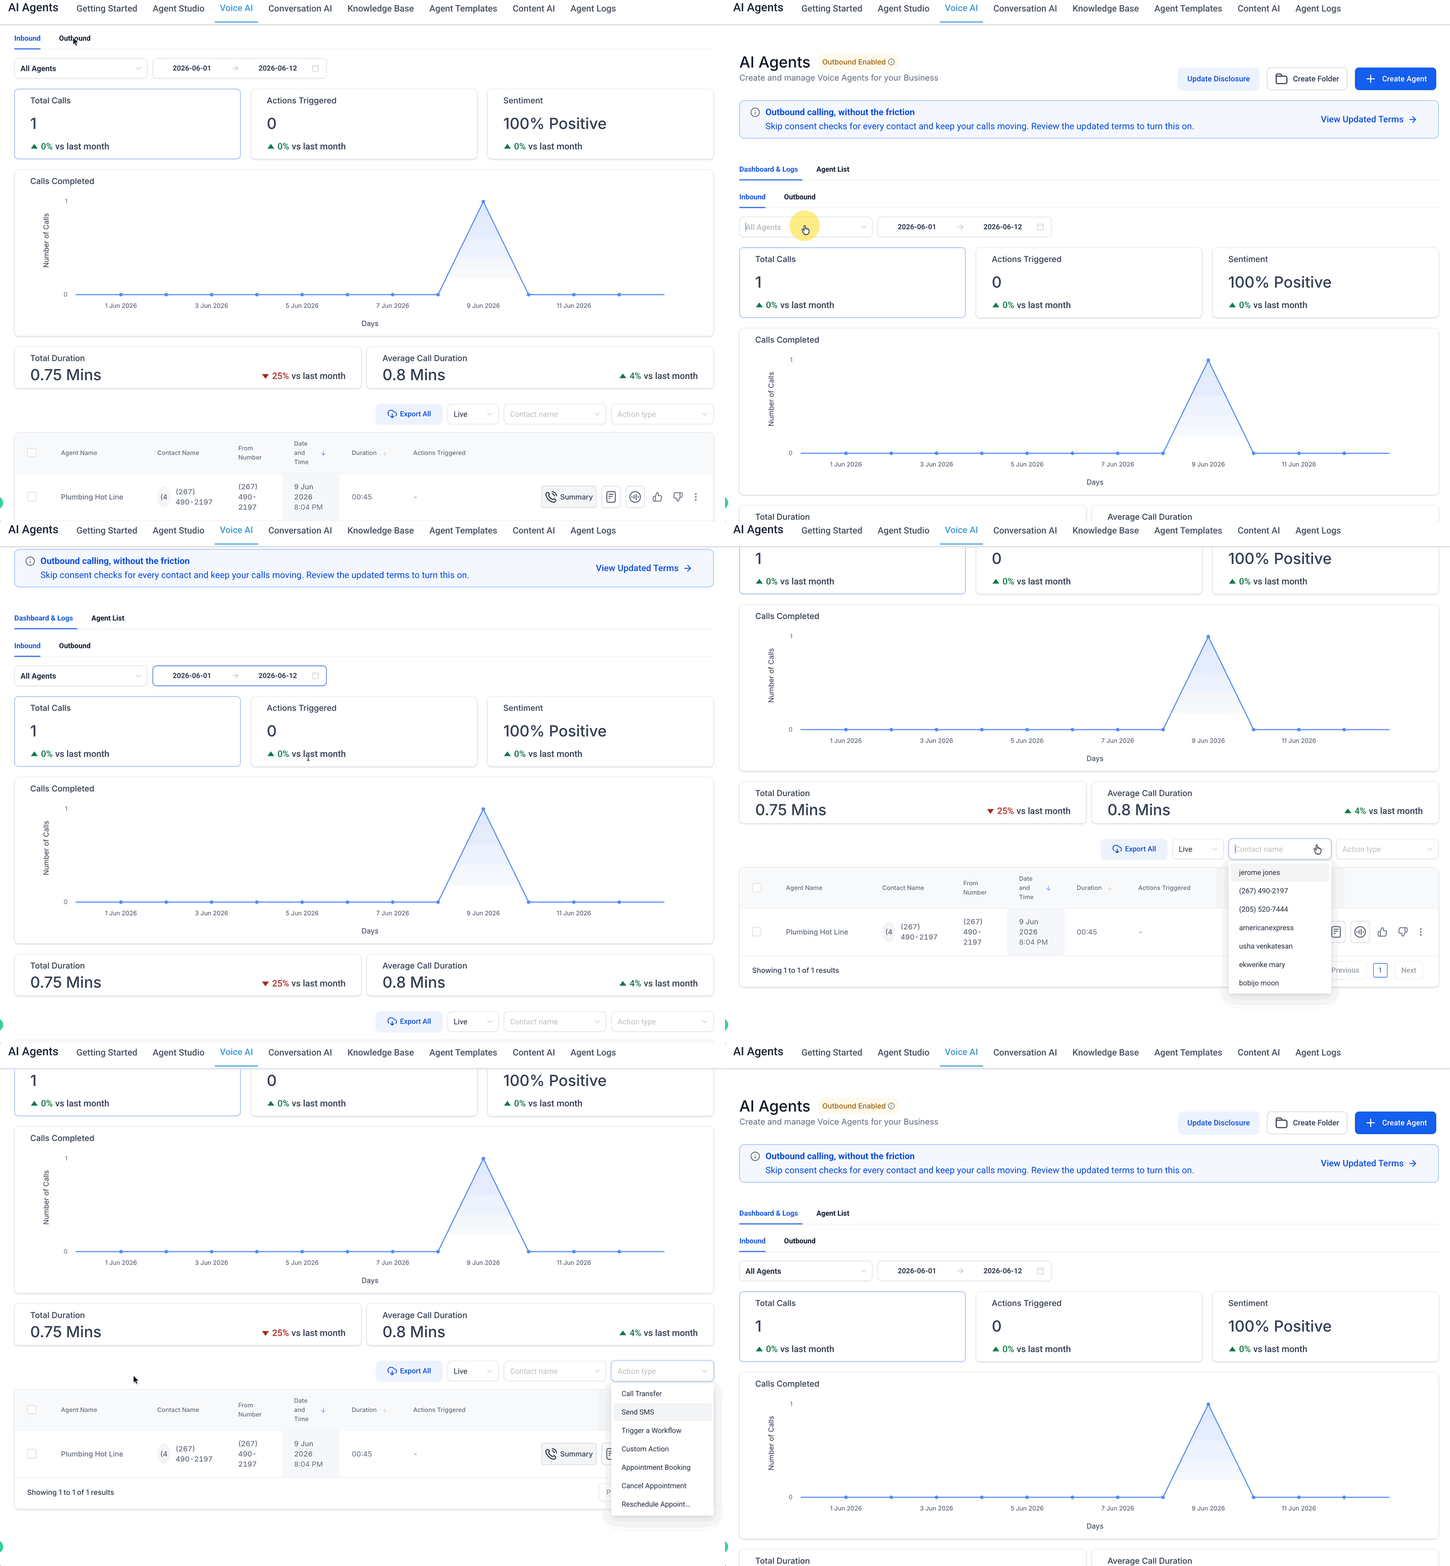
- Use the dashboard filters to choose the call type, agent, and date range you want to review.
Dashboard Views: Inbound and Outbound
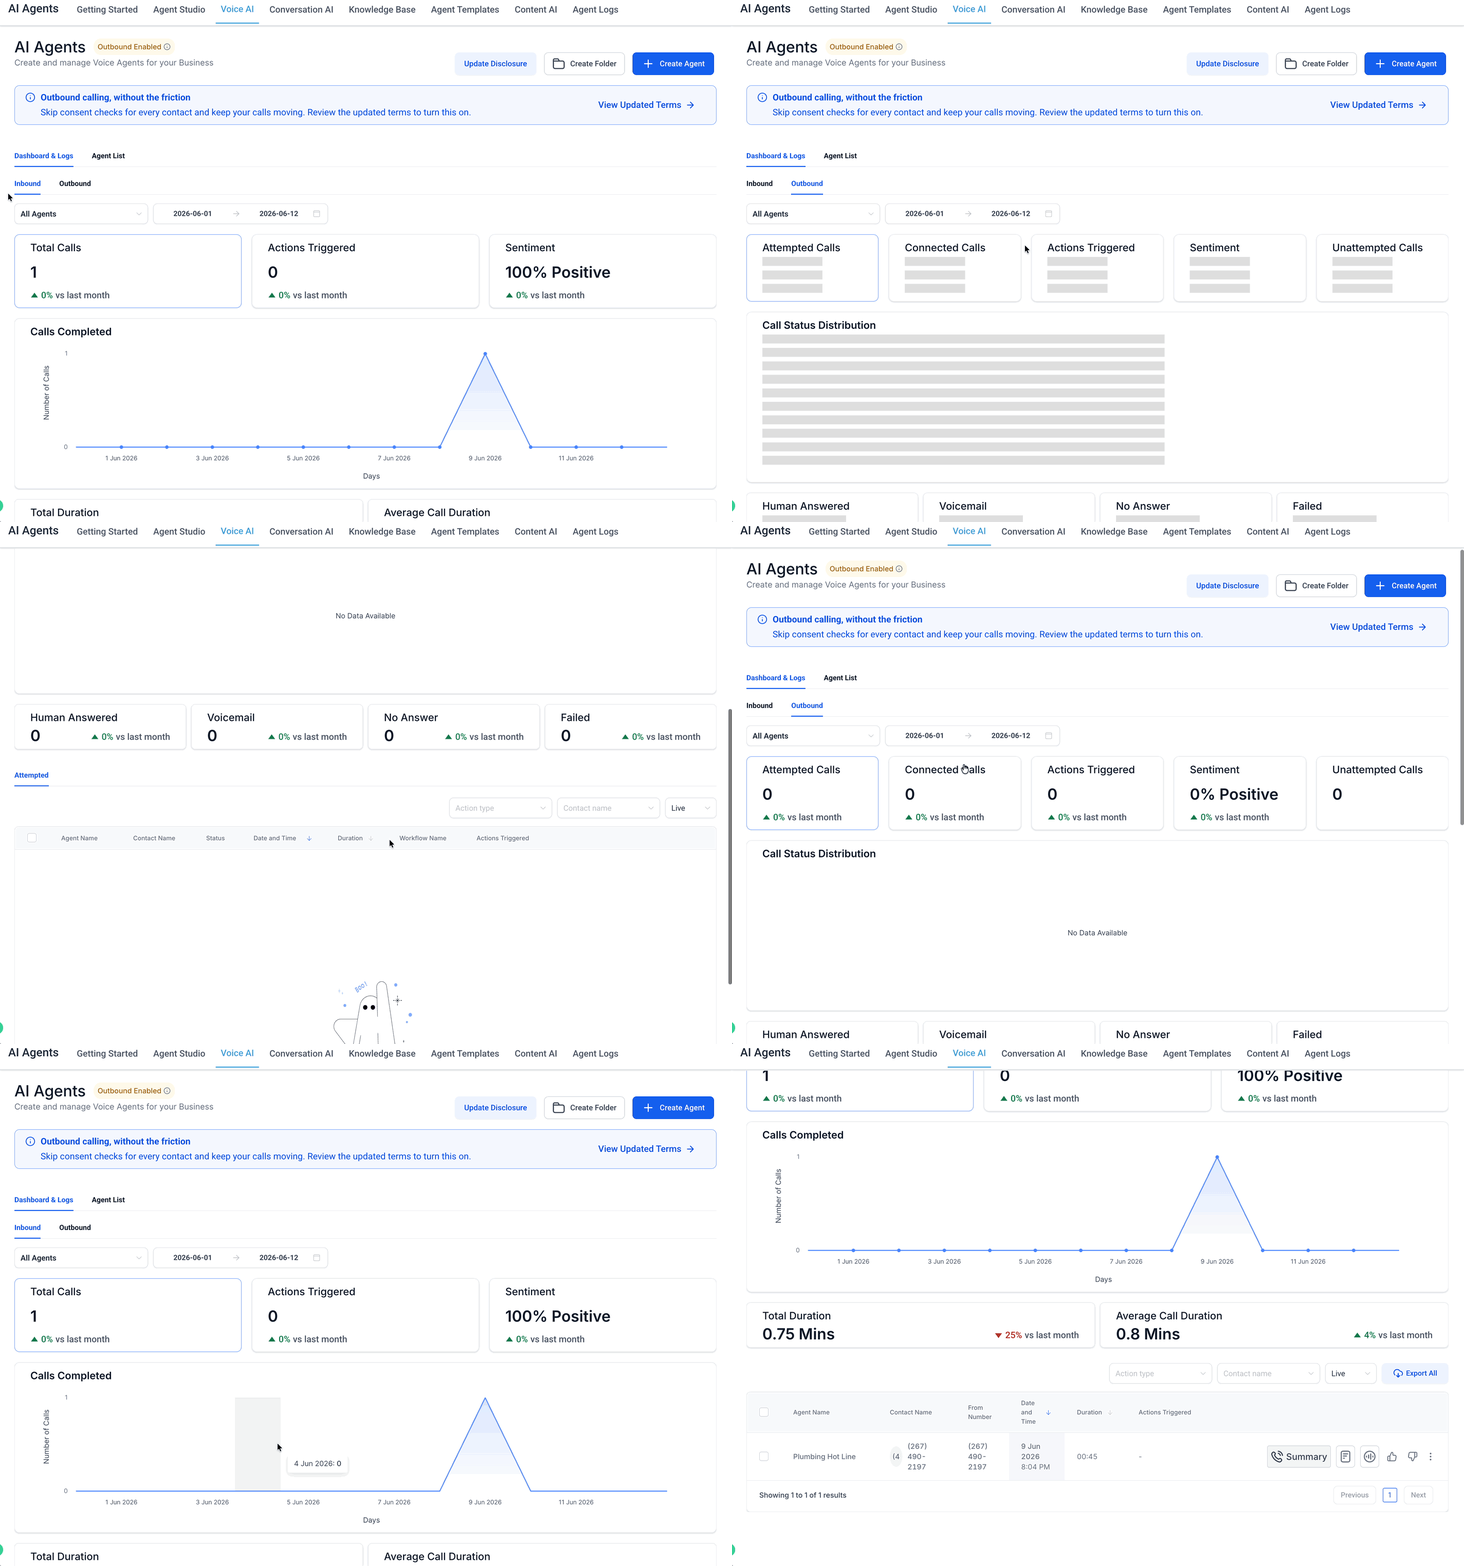
The dashboard includes separate views for inbound and outbound Voice AI activity. These views help you review the metrics that matter most for each call direction.
Inbound focuses on calls received by Voice AI agents. This view helps you understand how agents are handling incoming caller conversations, actions, and sentiment.
Outbound focuses on calls placed by Voice AI agents. This view helps you understand outbound call outcomes, such as whether calls were answered, went to voicemail, were not answered, or failed.
Inbound Dashboard Metrics
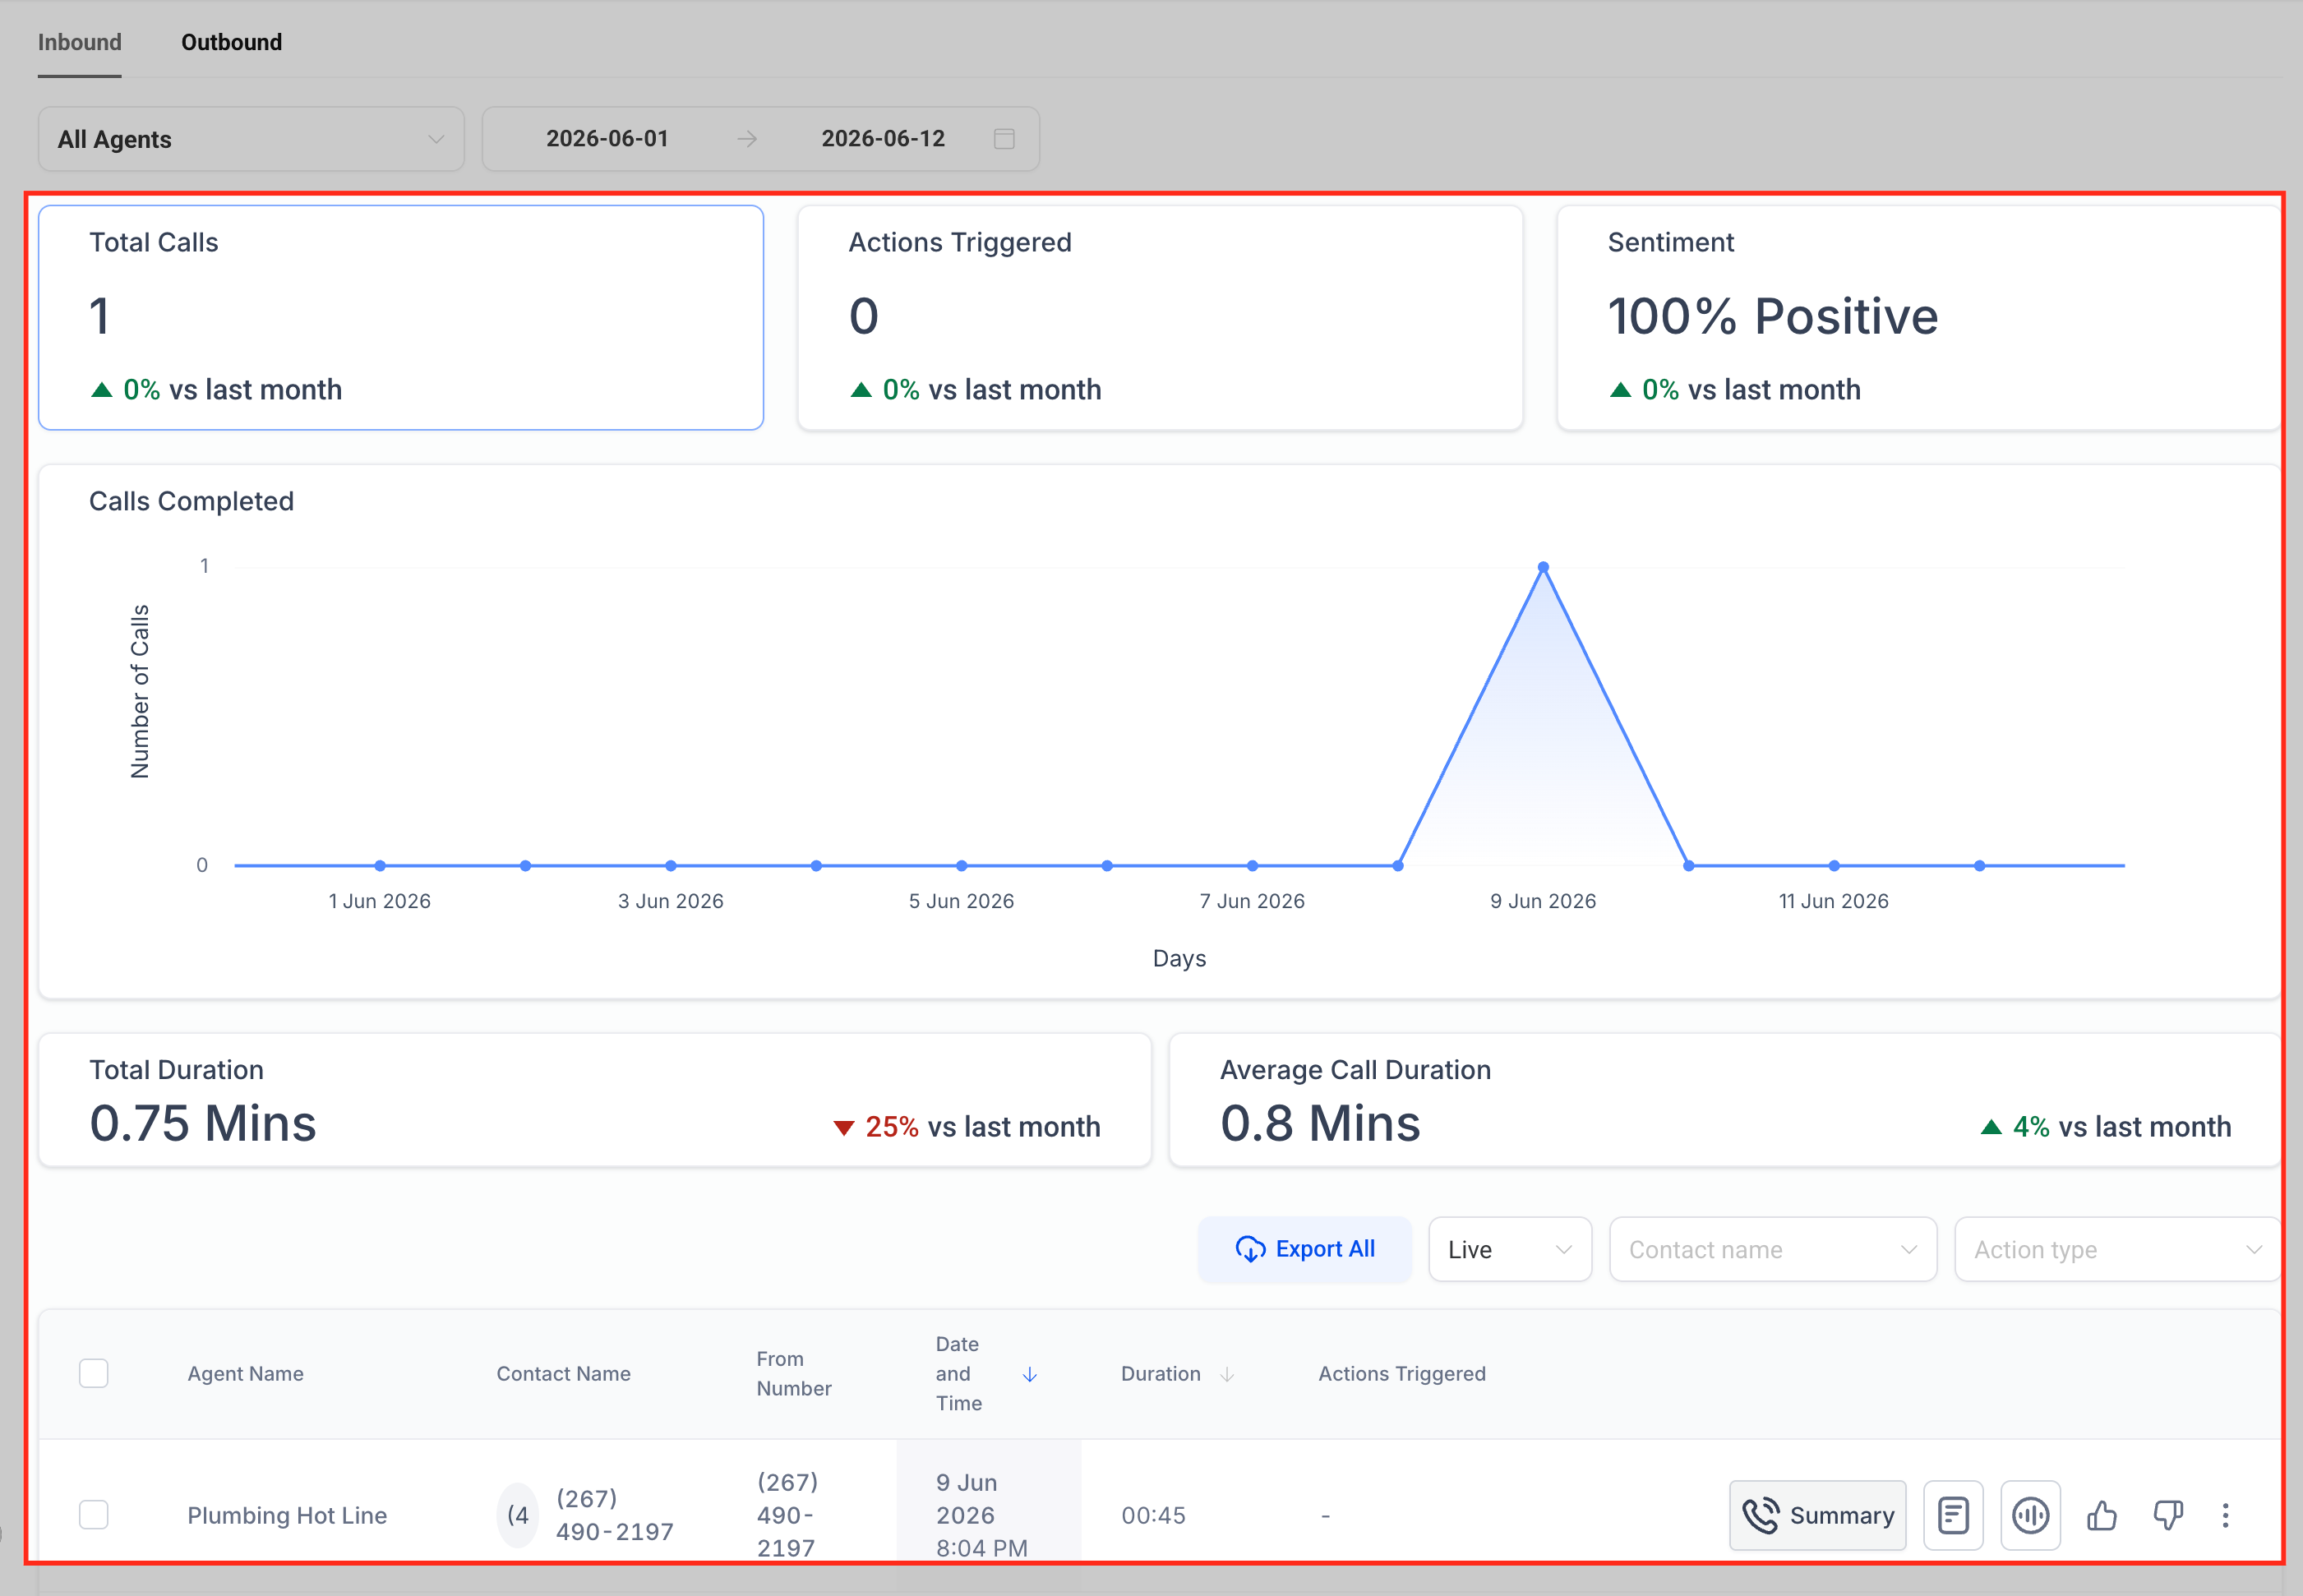
Inbound dashboard metrics show how Voice AI agents are handling incoming calls. These metrics help you understand call volume, engagement, actions completed, and caller experience.
Common inbound metrics may include:
- Total Calls: The number of inbound calls handled during the selected time period.
- Actions Triggered: The number of configured actions triggered during calls.
- Sentiment: AI-analyzed caller sentiment across calls.
- Calls Completed: A trend chart showing completed call activity over time.
- Total Duration: The total amount of call time for the selected period.
- Average Call Duration: The average length of completed calls.
- SMS Sent: The number of SMS actions sent by Voice AI.
- Workflows Triggered: The number of workflows triggered during calls.
- Call Transfers: The number of calls transferred.
- Custom Actions: The number of configured custom actions triggered.
- Appointment Booking: The number of appointment booking actions completed or attempted.
- Contact Info Updated: The number of times contact information was updated.
A sudden increase or decrease in these metrics may be caused by changes in call volume, campaigns, agent configuration, prompts, or action setup.
Outbound Dashboard Metrics
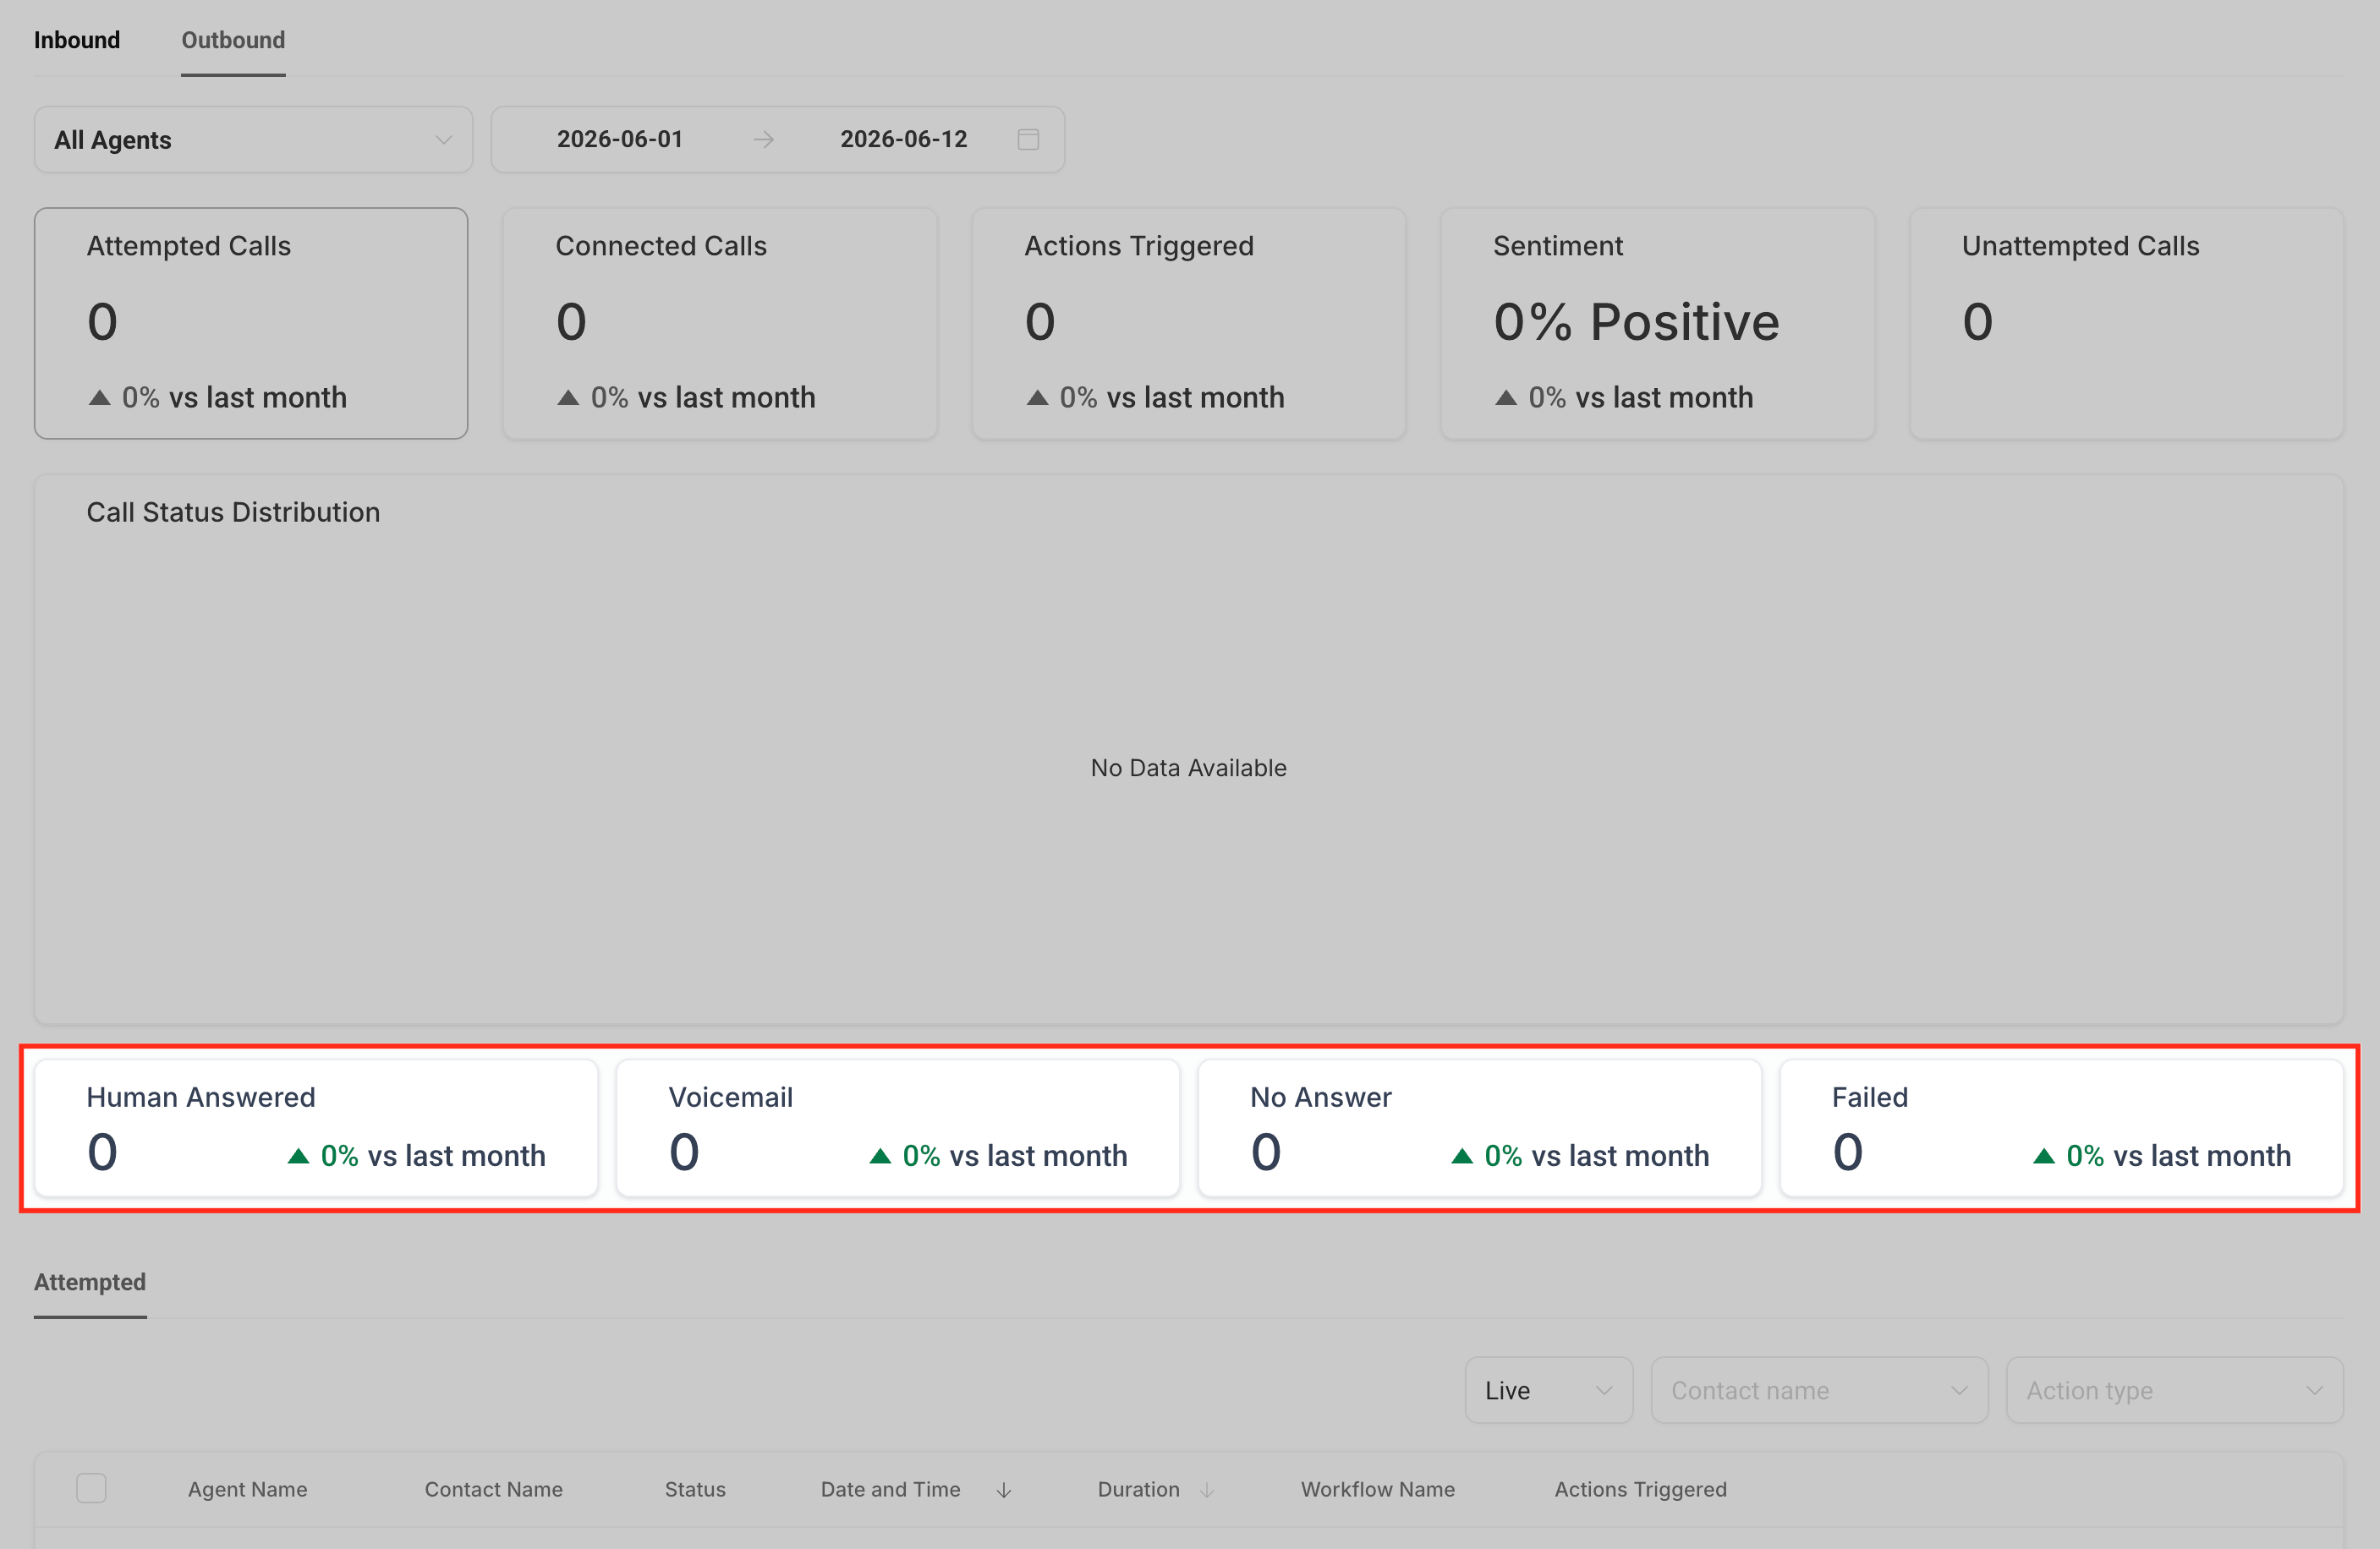
Outbound dashboard metrics help you review the results of calls placed by Voice AI agents. These metrics are useful for understanding connection rates and outbound call outcomes.
Common outbound metrics may include:
- Human Answered: Calls answered by a person.
- Voicemail: Calls that reached voicemail.
- No Answer: Calls that were not answered.
- Failed: Calls that could not be completed.
- Attempted Calls: A log or count of outbound call attempts.
Use outbound metrics to evaluate whether outbound campaigns are reaching contacts successfully and whether call outcomes align with expectations.
Actions Triggered
Actions Triggered shows how often Voice AI agents completed configured actions during calls. These metrics depend on the actions configured for the selected agent and the call scenarios that occurred during the selected time period.
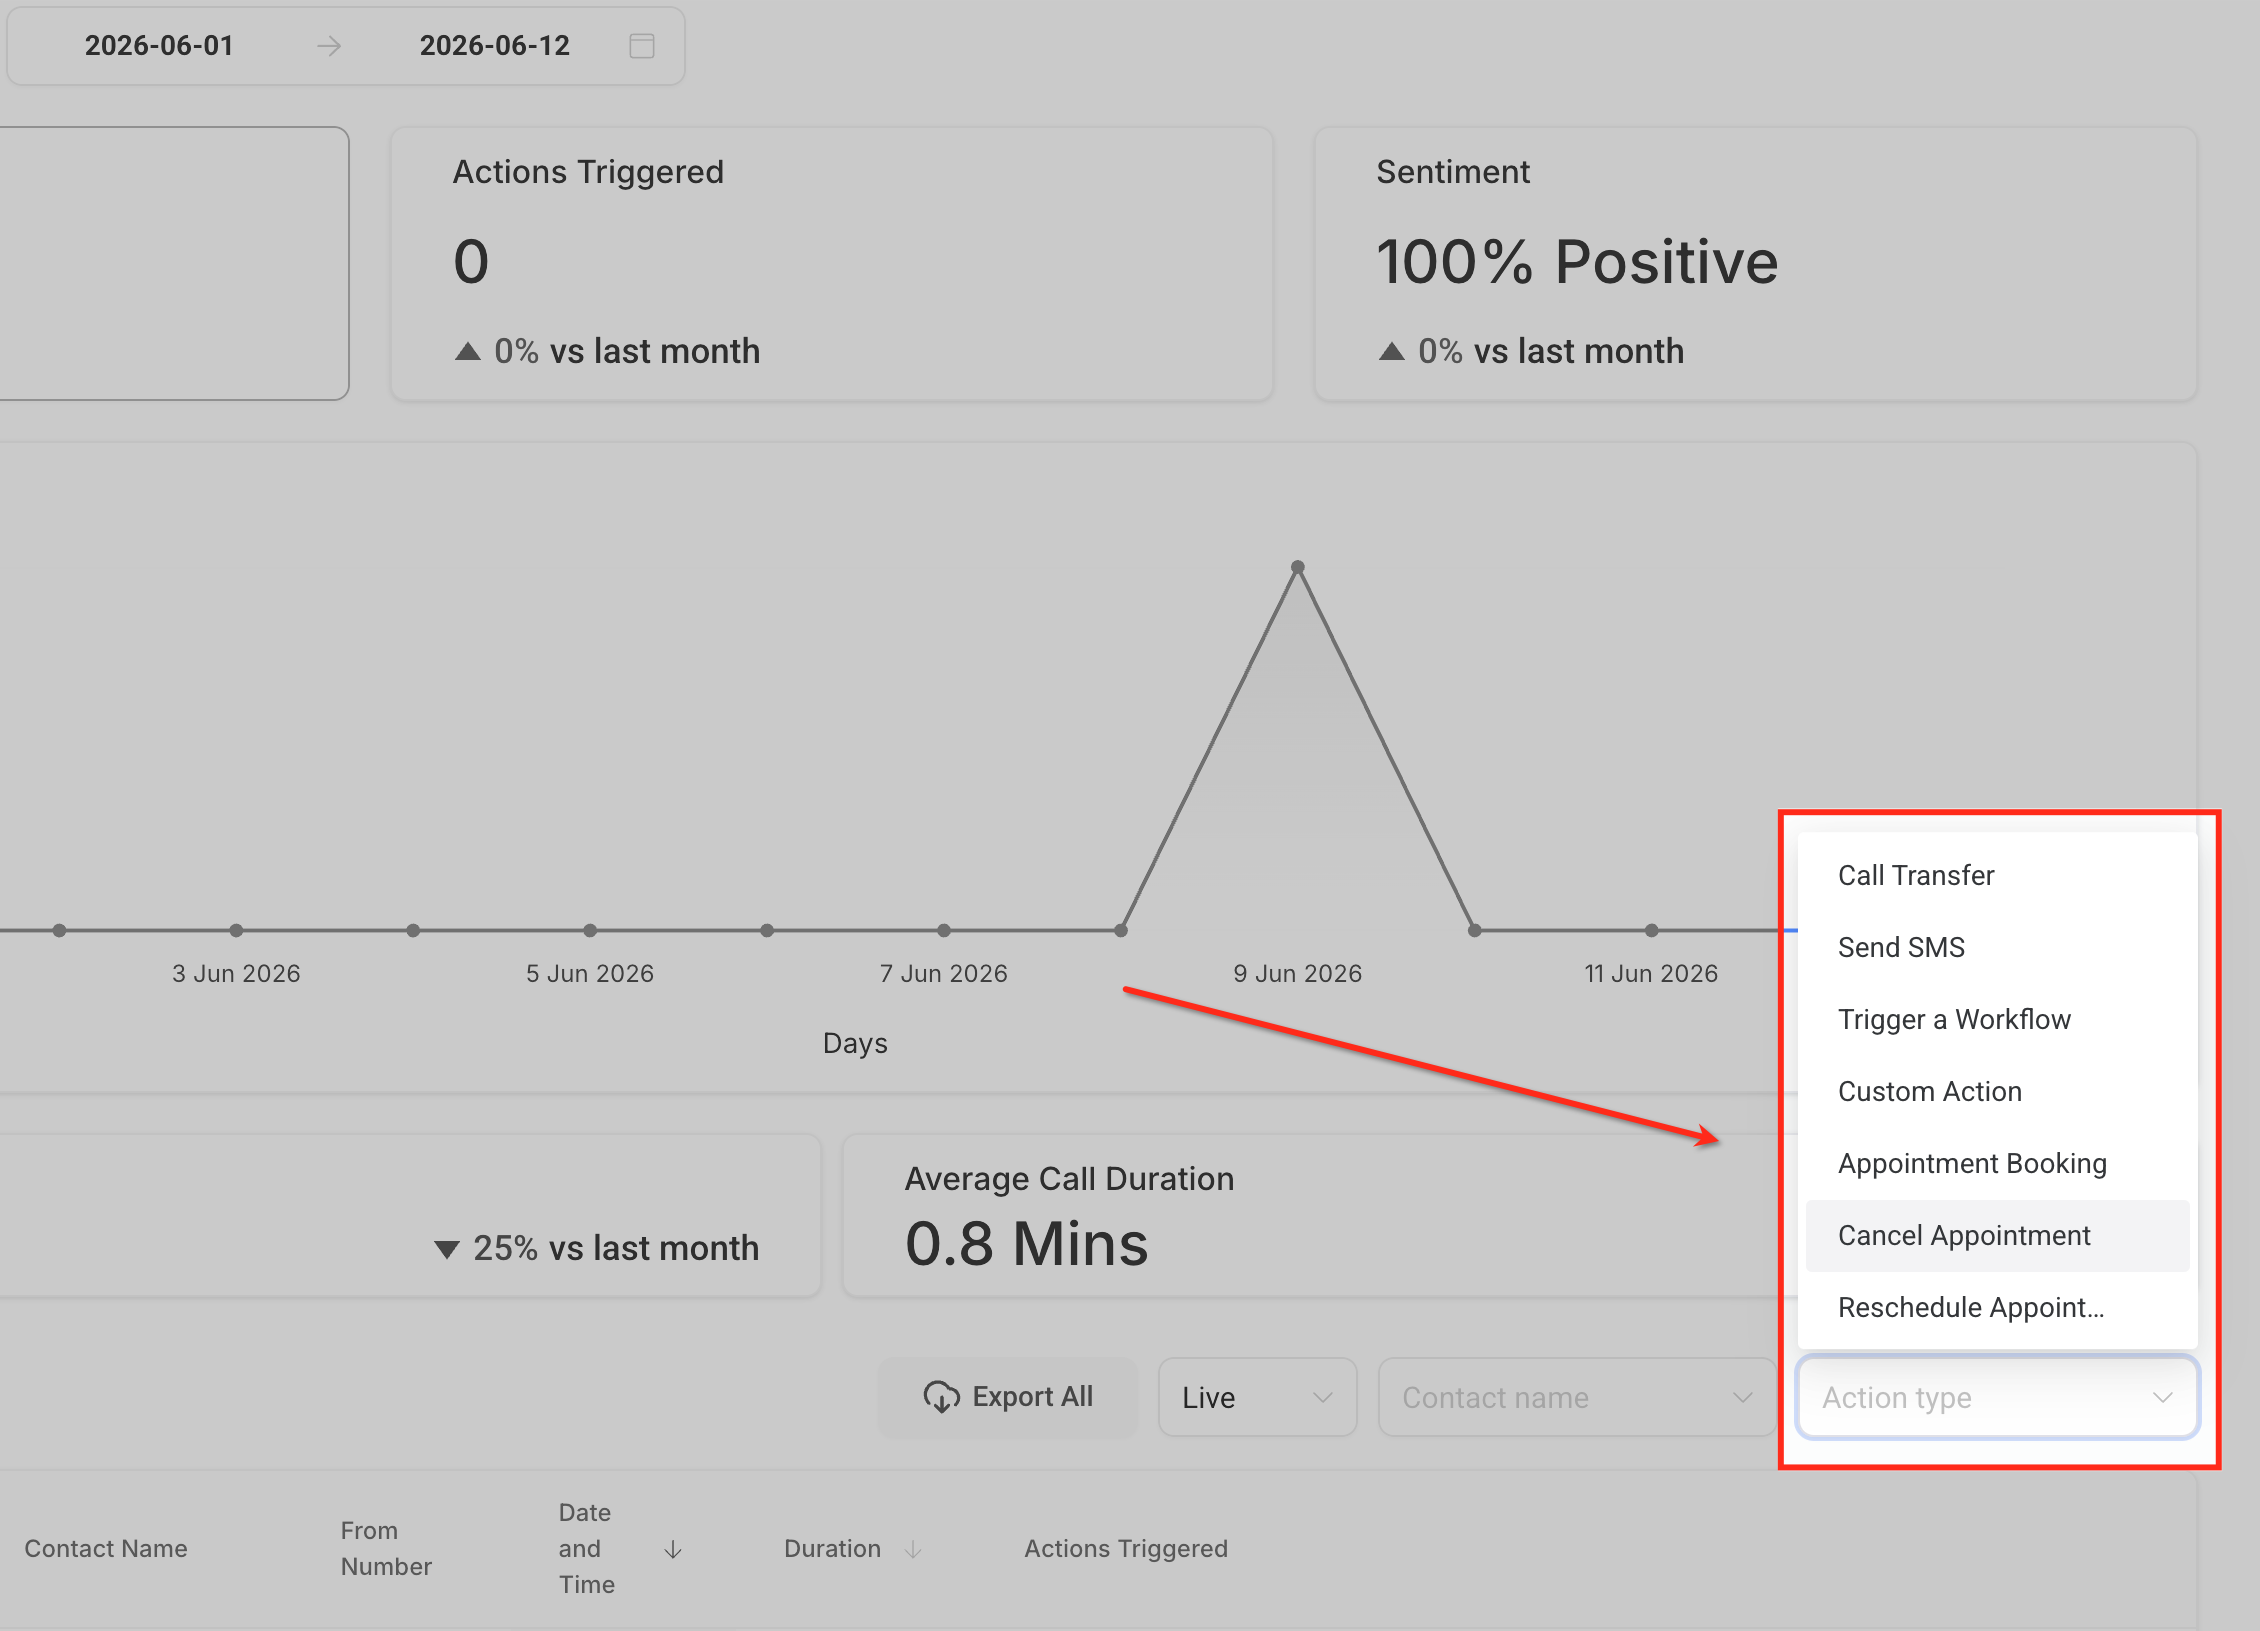
Actions may include:
- Call Transfer
- Send SMS
- Trigger a Workflow
- Custom Action
- Appointment Booking
- Cancel Appointment
- Reschedule Appointment
- Contact Info Updated
Use this data to confirm whether agents are completing the expected outcomes. For example, if an agent is designed to book appointments but Appointment Booking activity is low, review the prompt, booking setup, calendar availability, and call logs.
Sentiment Analysis
Sentiment Analysis groups calls into positive, neutral, or negative trends based on AI interpretation of caller experience. This can help you identify patterns in how callers respond to Voice AI interactions.
Use sentiment as a directional signal, not as a perfect customer satisfaction score. For full context, review call logs, transcripts, recordings, and call outcomes.
Examples of how to use sentiment:
- Review negative sentiment calls to identify confusing prompts or failed handoffs.
- Compare sentiment across agents to find agents that may need prompt or action updates.
- Look for sentiment changes after updating prompts, knowledge sources, or call routing.
Comparative Statistics and Percentage Changes
Some dashboard cards may show percentage changes compared with a previous reporting period. This helps you understand whether a metric is increasing or decreasing over time.
Percentage delta compares the selected reporting period with the previous equivalent period. For example, if you filter the dashboard to the last 7 days, the comparison reflects the previous 7-day period.
Review changes in context. A metric may increase or decrease because of:
- Higher or lower call volume
- New or paused campaigns
- Prompt changes
- Agent setting updates
- Calendar or workflow changes
- Seasonal call patterns
- Changes in inbound or outbound traffic
Filters
Filters help you narrow dashboard results so you can review the right agent, call direction, timeframe, or call activity. Applying filters changes the metrics and logs shown on the page.
Common filters may include:
- Inbound / Outbound: Switch between inbound and outbound call reporting.
- Agent: View data for all agents or a specific Voice AI agent.
- Date Range: Review performance for a selected time period.
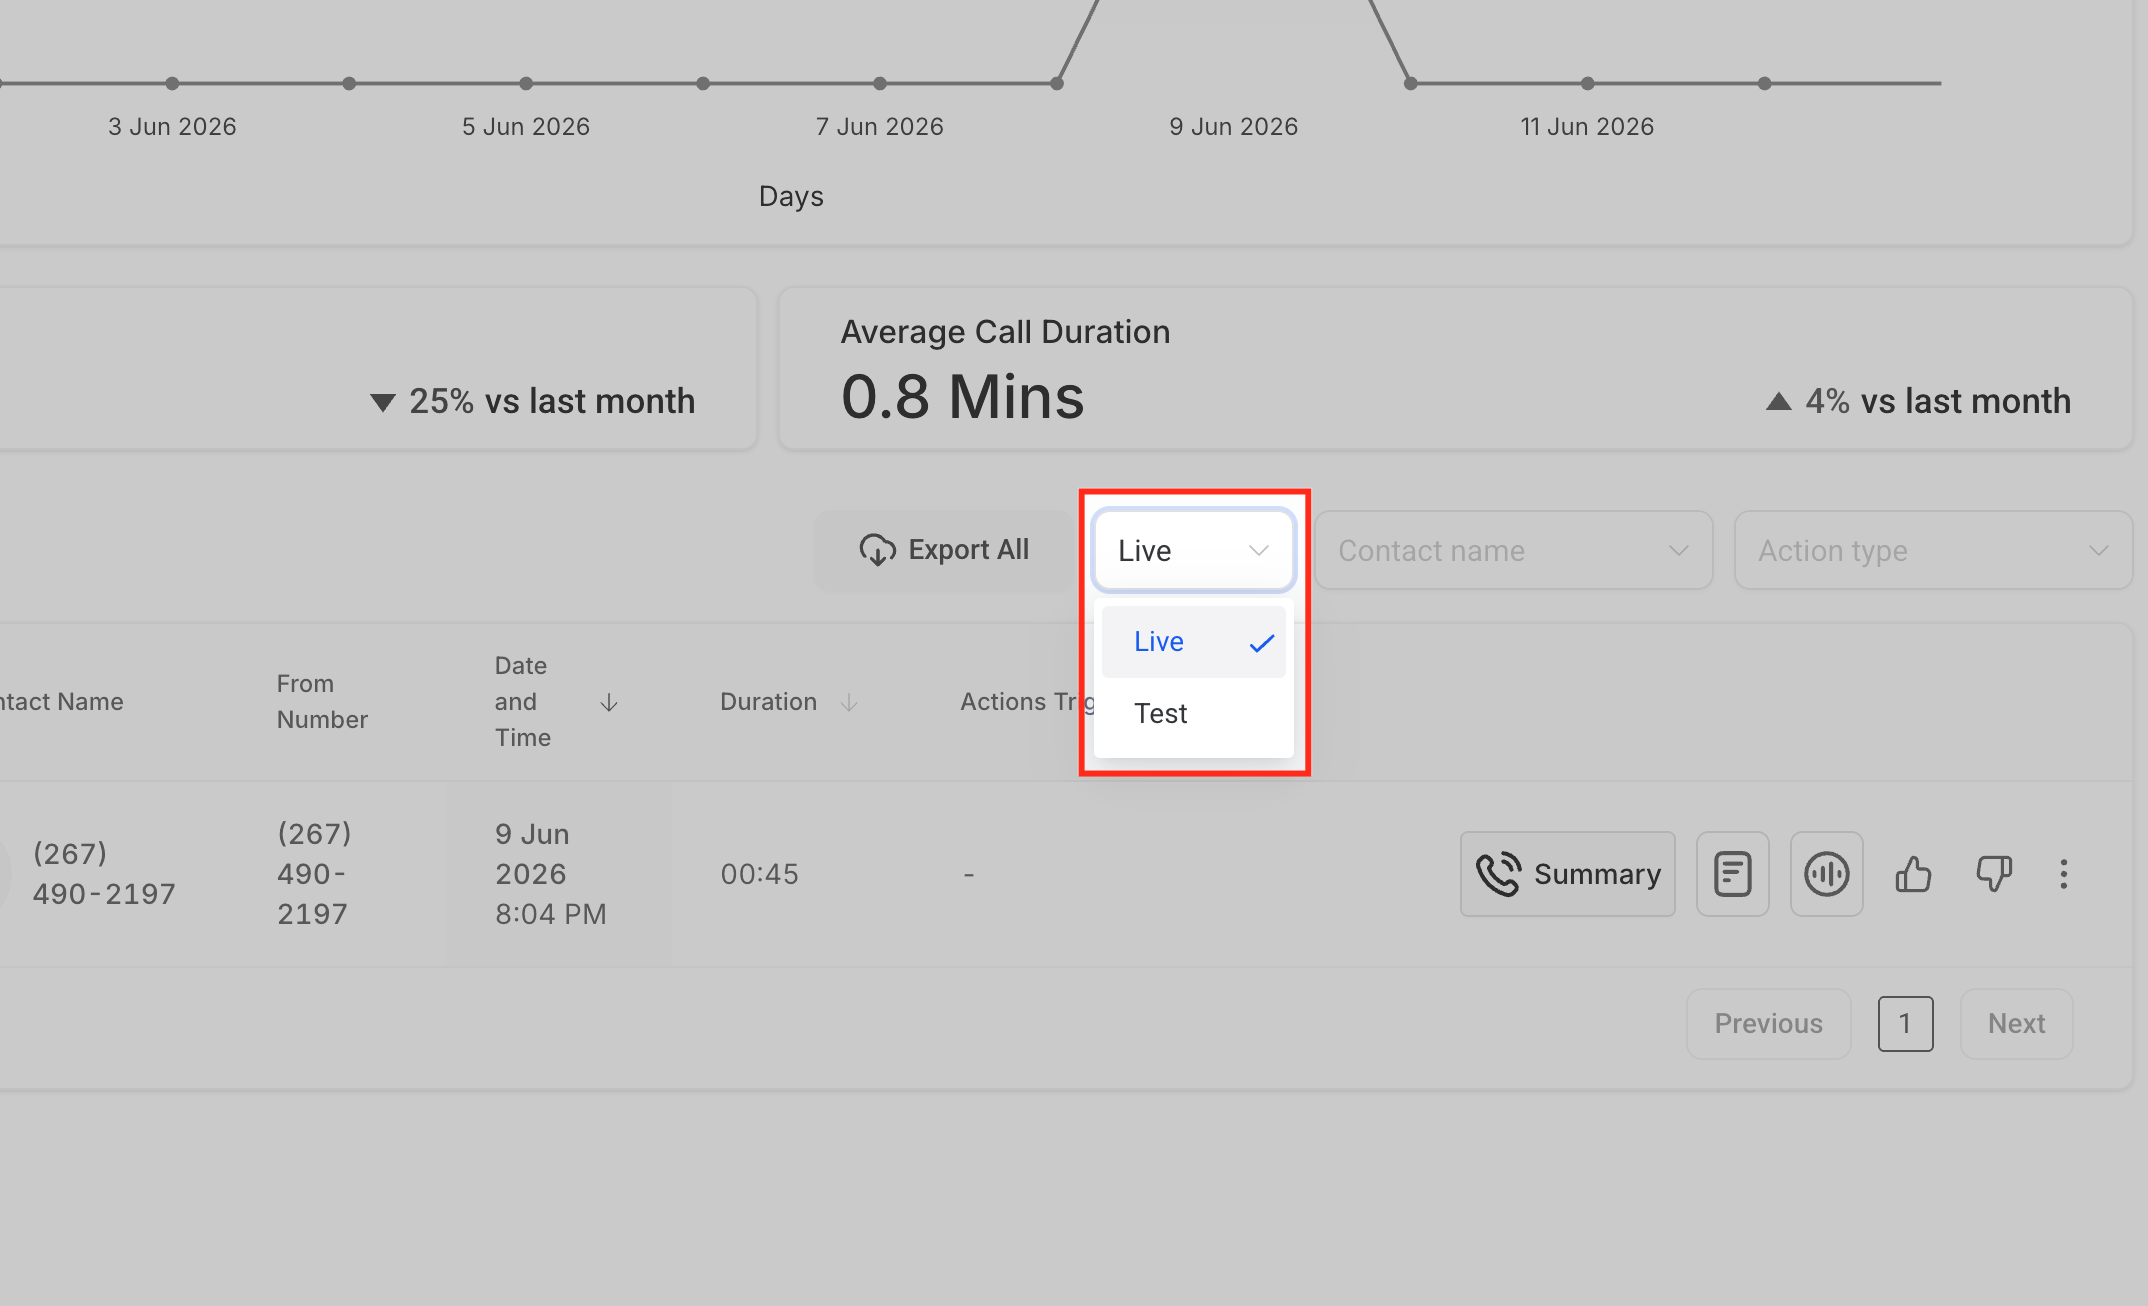
- Live / Test: Filter logs by live calls, test calls, or both.
- Contact Name: Search logs for a specific contact.
- Action Type: Filter logs by actions such as Call Transfer, Send SMS, Trigger a Workflow, Custom Action, Appointment Booking, Cancel Appointment, or Reschedule Appointment.
If metrics look lower or higher than expected, check the selected filters first.
Dashboard Metrics vs. Logs
Dashboard metrics and logs work together, but they serve different purposes. The dashboard gives you aggregate performance trends, while logs help you review specific calls and actions.
Area | Use It For | Example |
|---|---|---|
Dashboard Metrics | Reviewing trends and totals across selected agents or time periods | Total calls, average duration, sentiment, actions triggered |
Logs | Investigating individual calls or actions | Call details, test calls, contact-specific activity, action history |
Agent Logs | Reviewing deeper call execution details | Execution timeline, transfers, latency, failures, and debugging context |
Use the dashboard to find patterns. Use logs when you need to understand what happened during a specific call.
Live and Test Call Logs
The logs area can help you review both live and test call activity. This is useful when you want to validate agent behavior before launch or investigate a specific call after it happens.
Test calls may appear in dashboard logs when filtered by call type, but test calls are excluded from dashboard analytics and performance metrics. This means a test call can appear in logs without increasing dashboard totals such as Total Calls or Actions Triggered.
Use the Live / Test filter to separate live customer calls from test calls.
How To Use Dashboard Insights
Dashboard insights are most useful when you connect the numbers to specific follow-up actions. Use the dashboard to identify trends, then review logs or agent settings to understand what may need improvement.
Examples:
- High call volume with low action completion: Review whether the agent prompt clearly guides callers toward the intended action.
- Long average call duration: Review transcripts to see whether callers are confused, asking complex questions, or being routed inefficiently.
- Negative sentiment trend: Review call recordings or transcripts to identify frustrating moments in the conversation.
- Low workflow trigger count: Confirm the workflow action is configured and that the agent has clear instructions for when to trigger it.
- Low appointment booking activity: Review calendar availability, booking setup, prompt instructions, and appointment-related logs.
- Agent performance differences: Filter by agent to compare results and identify which agents may need prompt, action, or knowledge updates.
Frequently Asked Questions
Q: What does the Voice AI Agents Dashboard show?
It shows Voice AI performance data such as call activity, duration, triggered actions, sentiment trends, filters, and logs.
Q: What is the difference between dashboard analytics and logs?
Dashboard analytics show aggregate performance trends. Logs show individual call or action records that can be reviewed in more detail.
Q: Are test calls included in dashboard analytics?
No. Test calls may appear in logs, but they are excluded from dashboard analytics and performance metrics.
Q: Can I filter the dashboard by agent?
Yes. Use the agent filter to review all agents or a specific Voice AI agent.
Q: What does percentage delta mean?
Percentage delta compares the selected reporting period with the previous equivalent period.
Q: What does sentiment analysis measure?
Sentiment analysis uses AI to estimate whether caller experience appears positive, neutral, or negative. Review logs or recordings for full context.
Q: Why is my dashboard empty?
The selected filters may not include any live call activity, or the agent may not have completed calls during the selected date range.
Q: Why are action counts different from workflow activity?
Dashboard action counts reflect Voice AI actions triggered during calls. Workflow activity may have its own execution records and filters.
Q: When should I use Agent Logs instead of the dashboard?
Use Agent Logs when you need call-level details such as execution timeline, transfers, latency, failures, or debugging context.
Q: Can I review outbound-specific performance?
Yes. Use the Outbound dashboard view to review outbound outcomes such as Human Answered, Voicemail, No Answer, Failed, and attempted calls.