
Blog Analytics gives you a clear, single view of your blog’s performance. Track page views, follow engagement trends, and spot top posts to refine your content strategy. This article shows where to find Blog Analytics in SourCherry and how to use each chart and metric to make confident, data-driven decisions.
TABLE OF CONTENTS
- What is Blog Analytics?
- Key Benefits of Blog Analytics
- How To Find and Use Blog Analytics
- Frequently Asked Questions
- Related Articles
What is Blog Analytics?
It is an analytics feature within SourCherry that consolidates key performance metrics of your blogs and posts. By gathering data on page views, clicks, device usage, and more, it empowers you to understand audience behavior and refine your content strategy for optimal engagement.
Key Benefits of Blog Analytics
Blog analytics offers a range of advantages that help content creators and marketers make informed, data-driven decisions:
- At a glance: Quickly verify overall blog performance with high-level metrics.
- Repeat what works: Identify top-performing posts to replicate success.
- Know your readers: Understand audience behavior through device and category insights.
- Check engagement: Monitor link-click activity to gauge interest.
- Compare content sources: Distinguish the performance of imported posts versus manually created content.
How To Find and Use Blog Analytics
Note: Data captured from 28th Aug, 2024. Any data before this date will be shown as Unknown.
- Log in to your sub-account.
- Click on the Sites tab.
- Click on the Analytics tab.
- Click on the category selector drop-down and select Blogs.
- Allow the dashboard to load—your blog performance metrics will display once available.
- Utilize the date range selector and blog site selector to tailor the data view to your needs.
- Review each sub-section (e.g., Quick Performance Overview, Trends Over Time) to gain detailed insights into your blog’s activity.
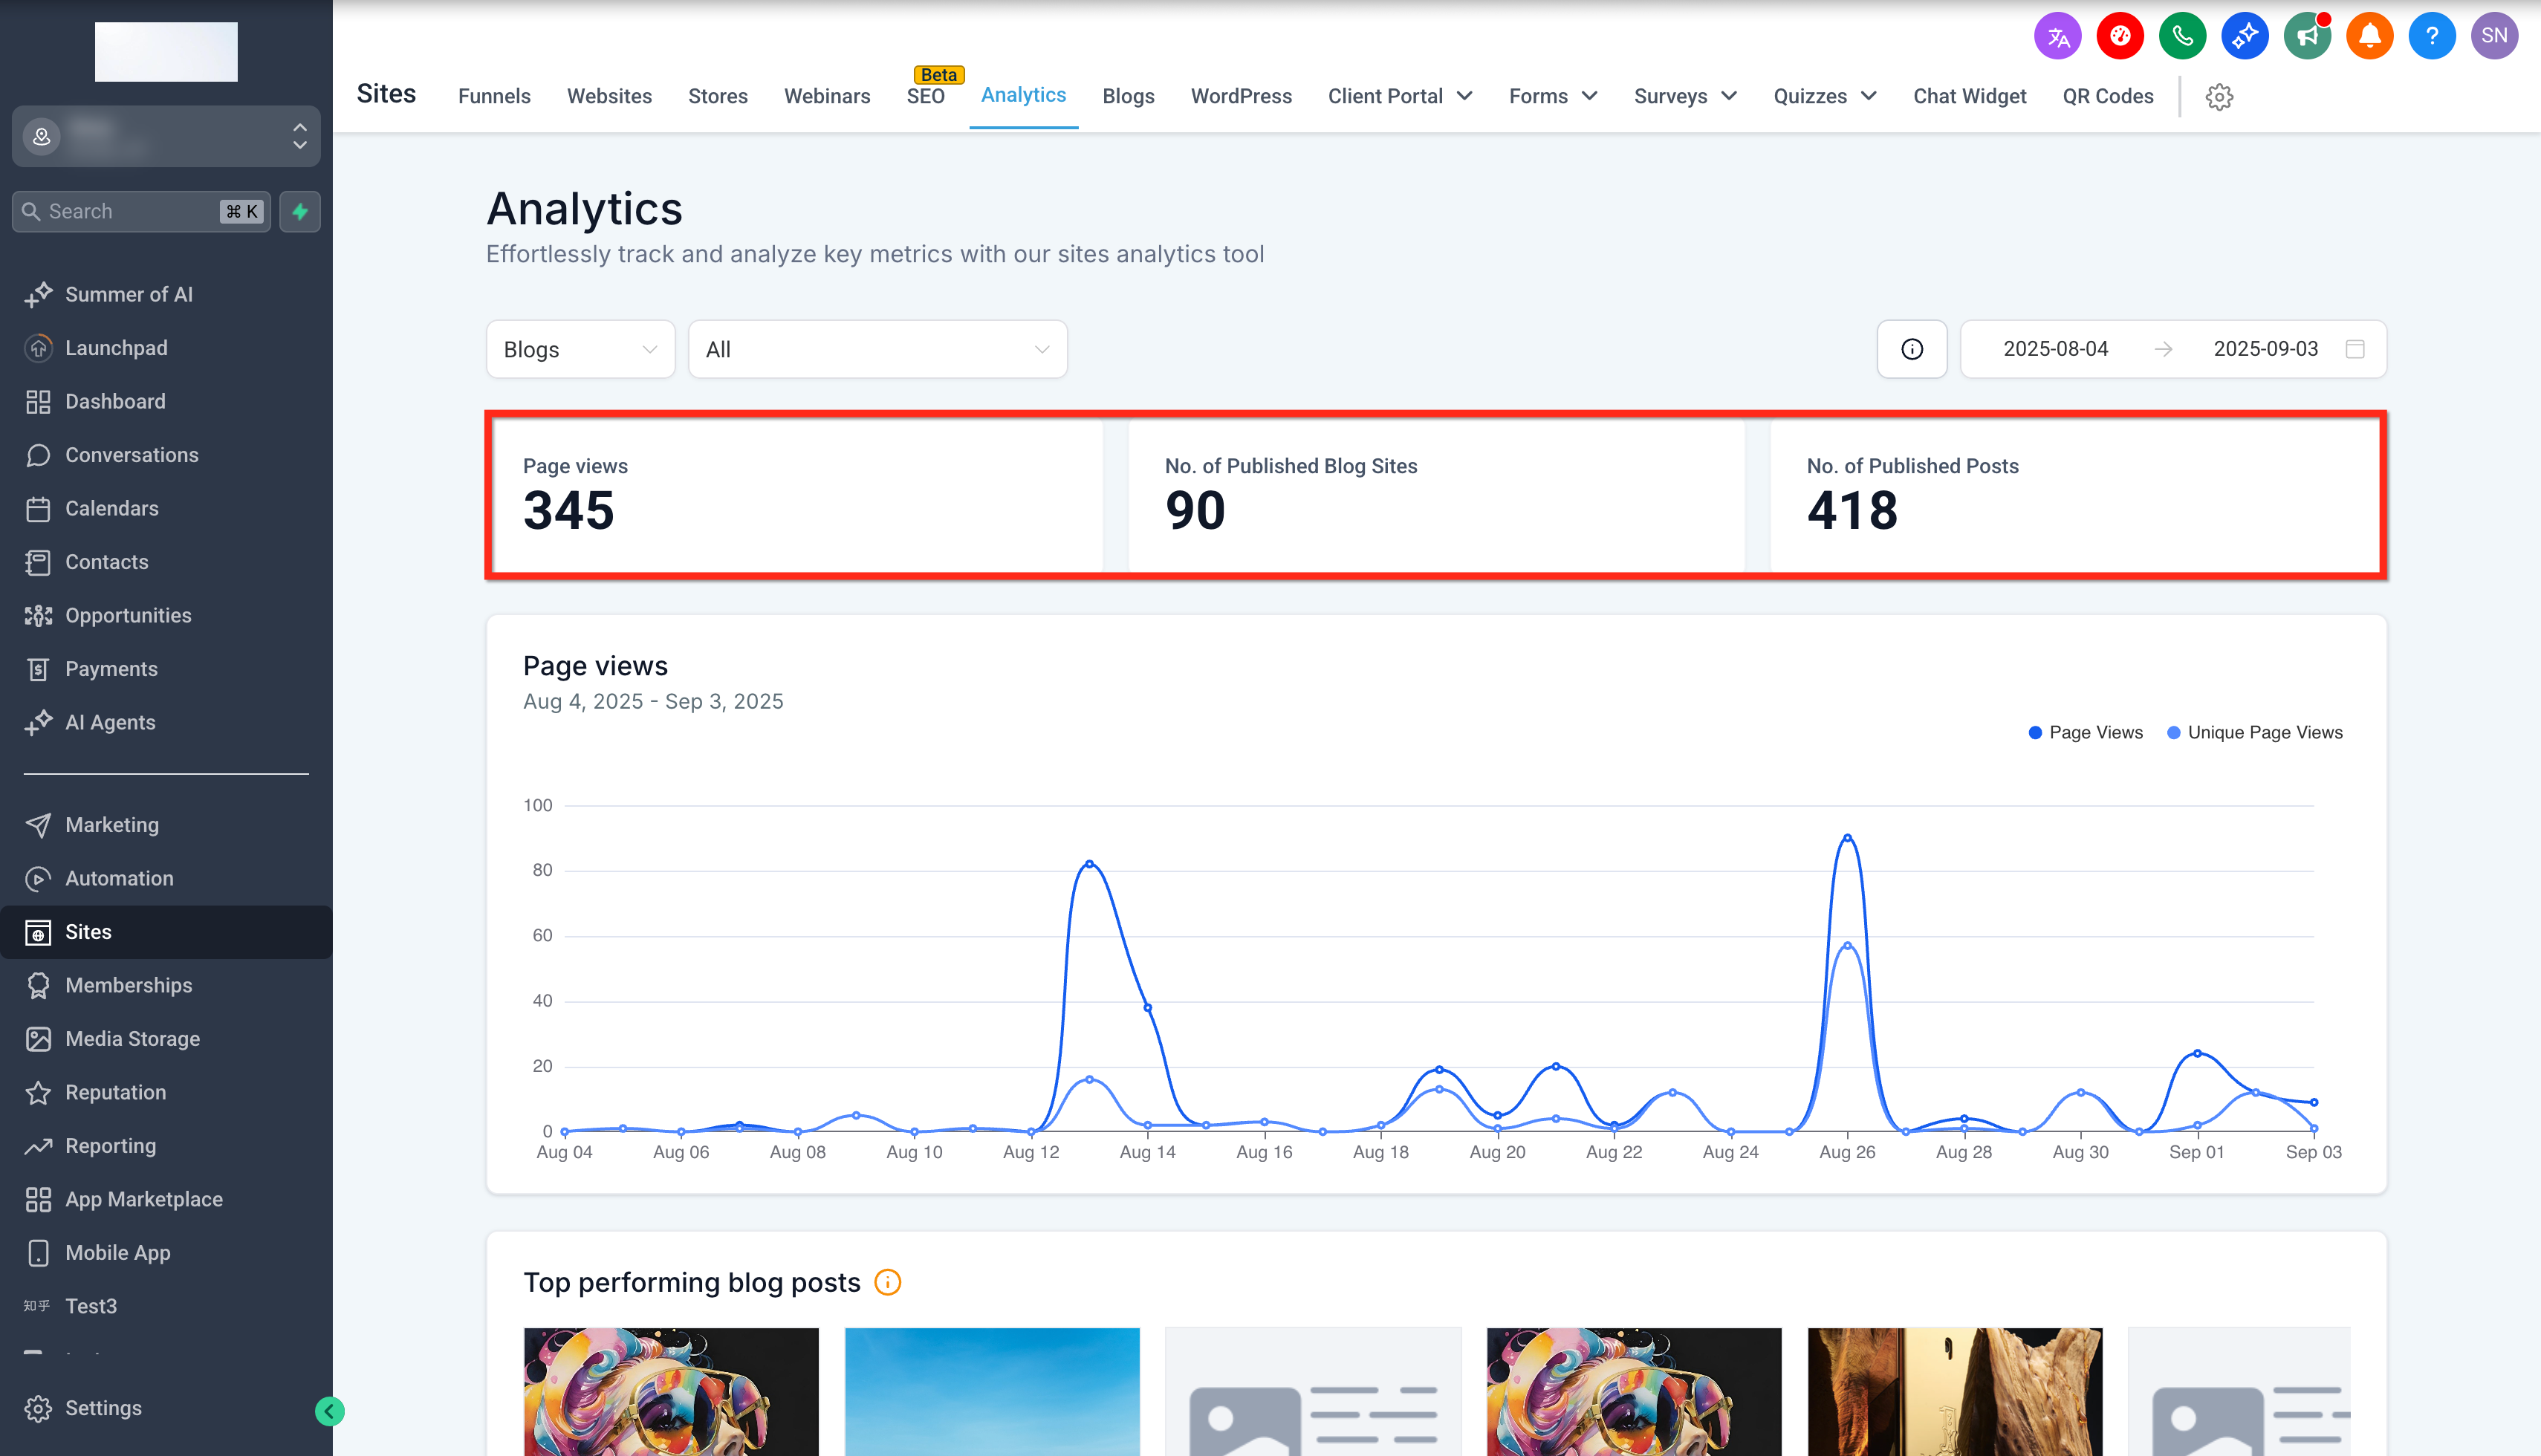
Quick Performance Overview
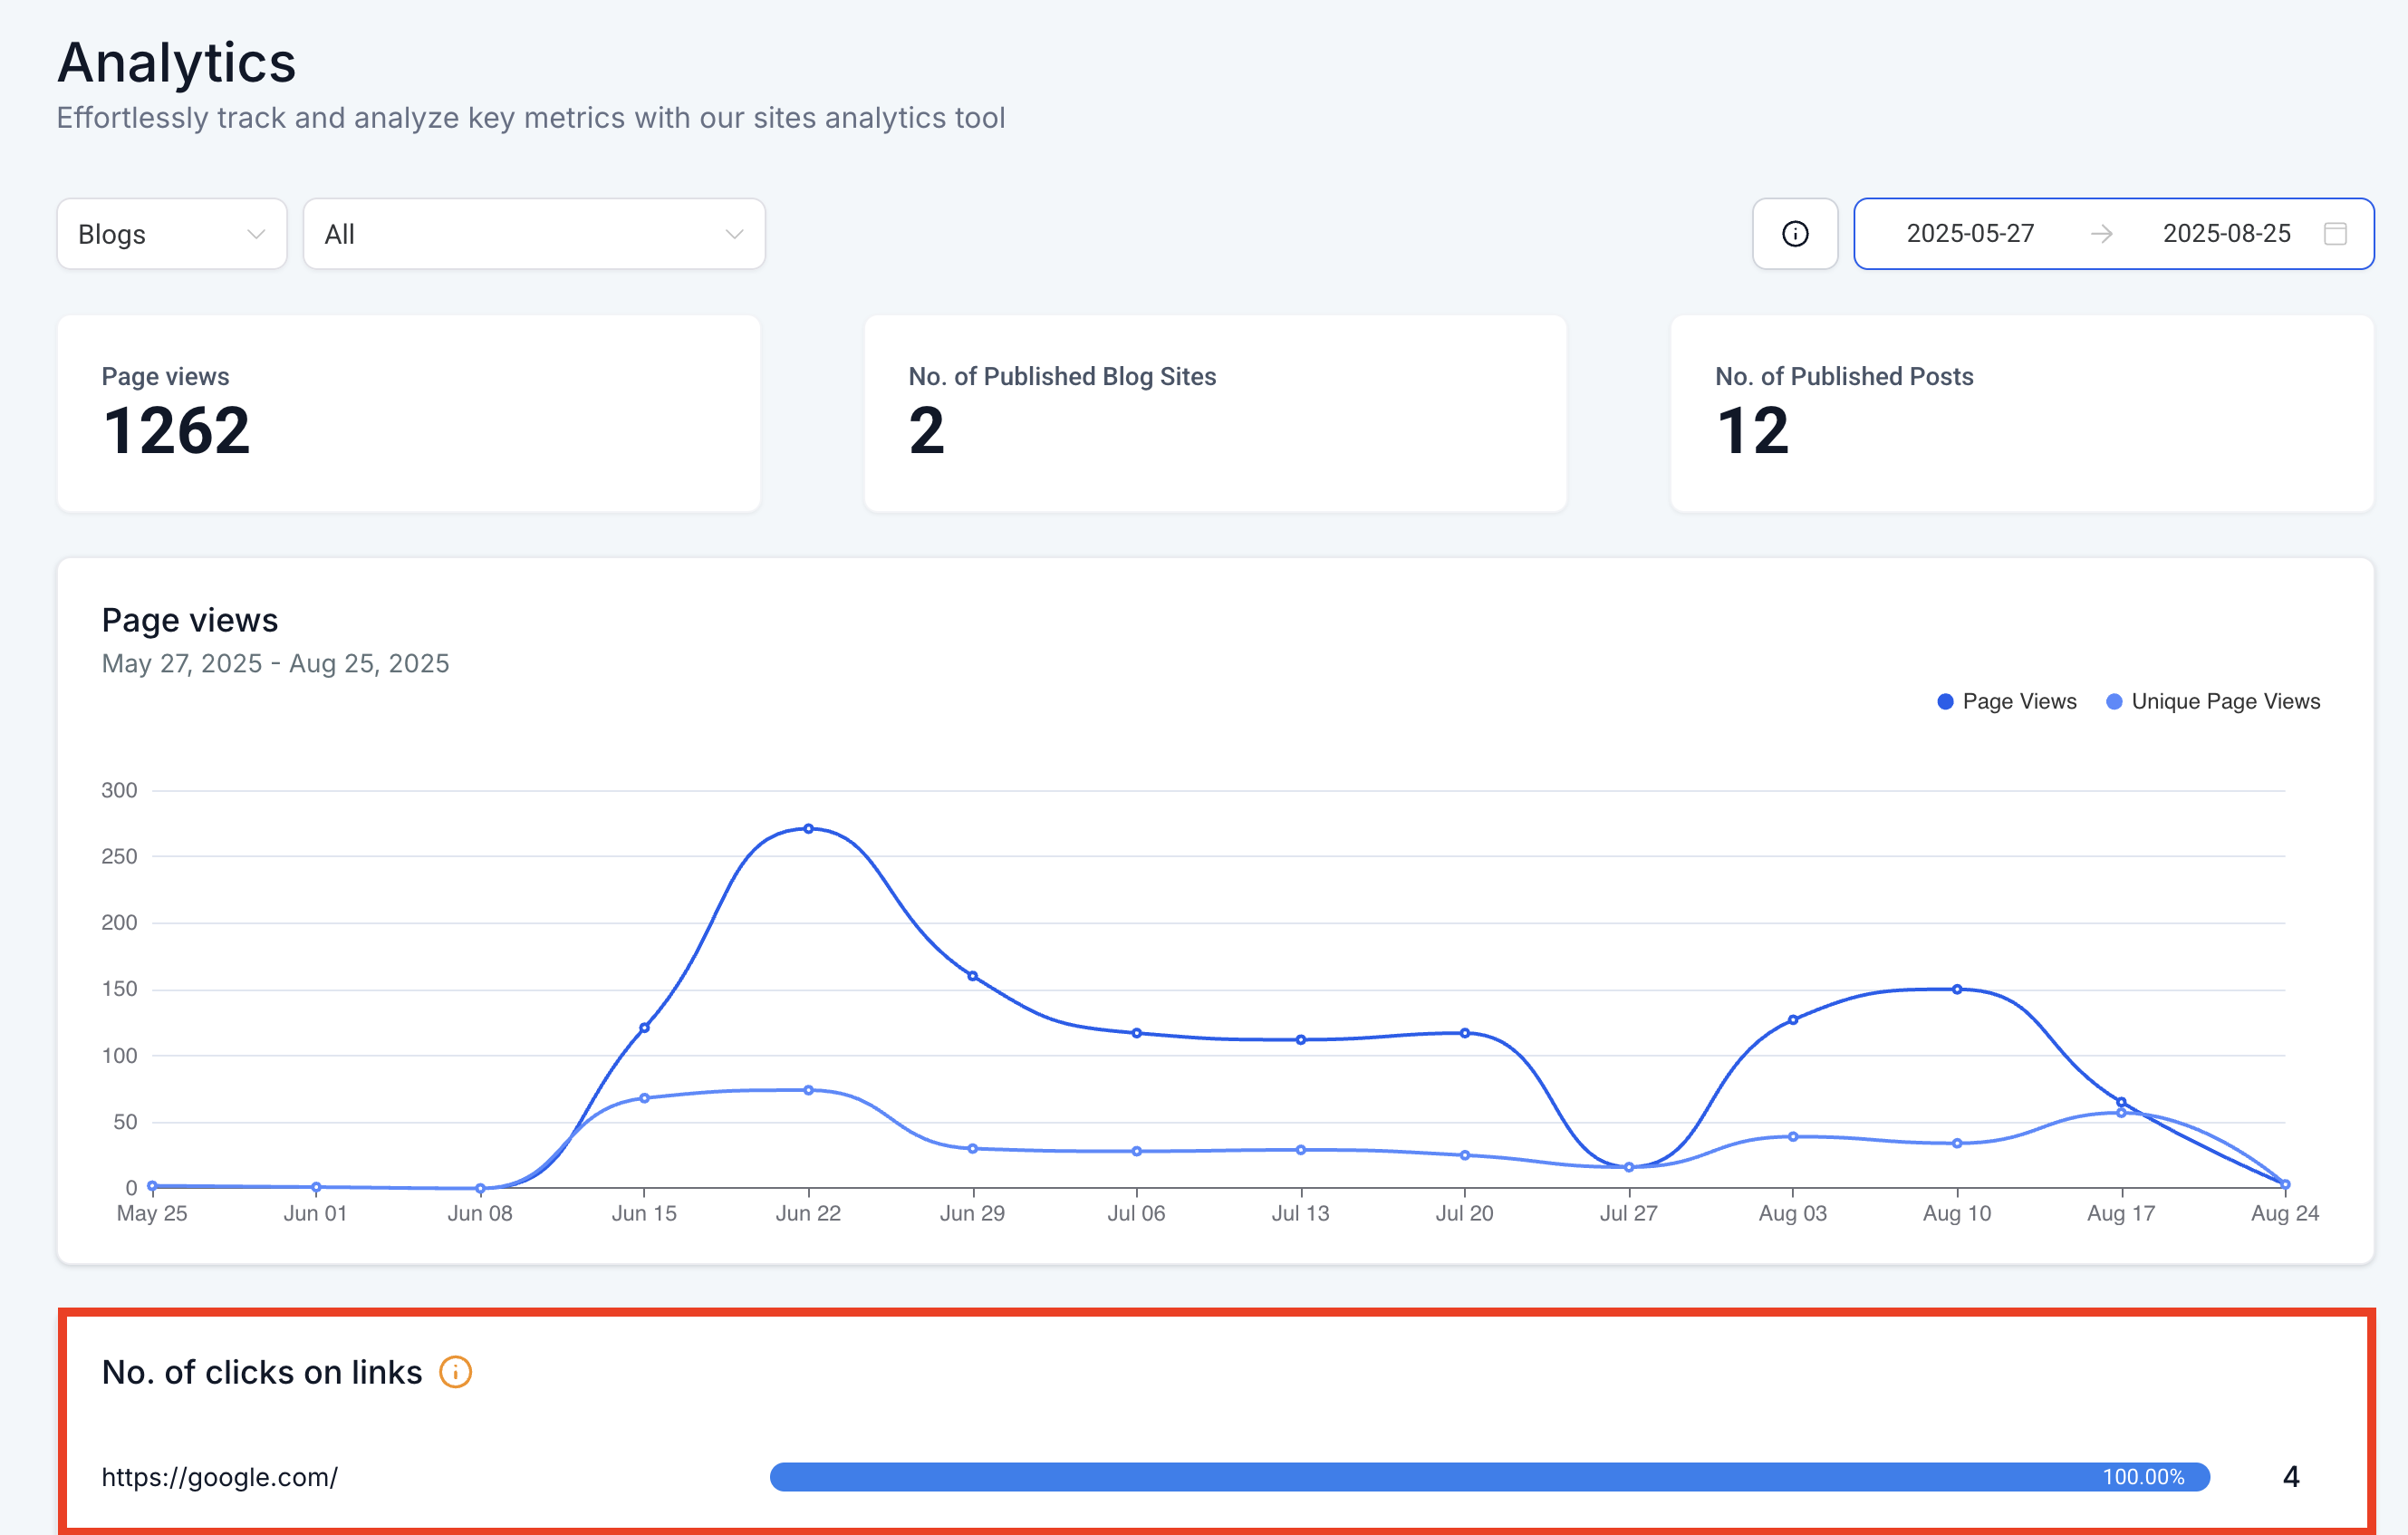
Quick Performance Overview delivers a high-level snapshot of your blog’s critical performance metrics. It highlights total page views, the number of published blog sites, and total published posts—providing a fast, digestible understanding of your overall blog health.
- Instant display of total page views
- Count of published blog sites
- Tally of published posts
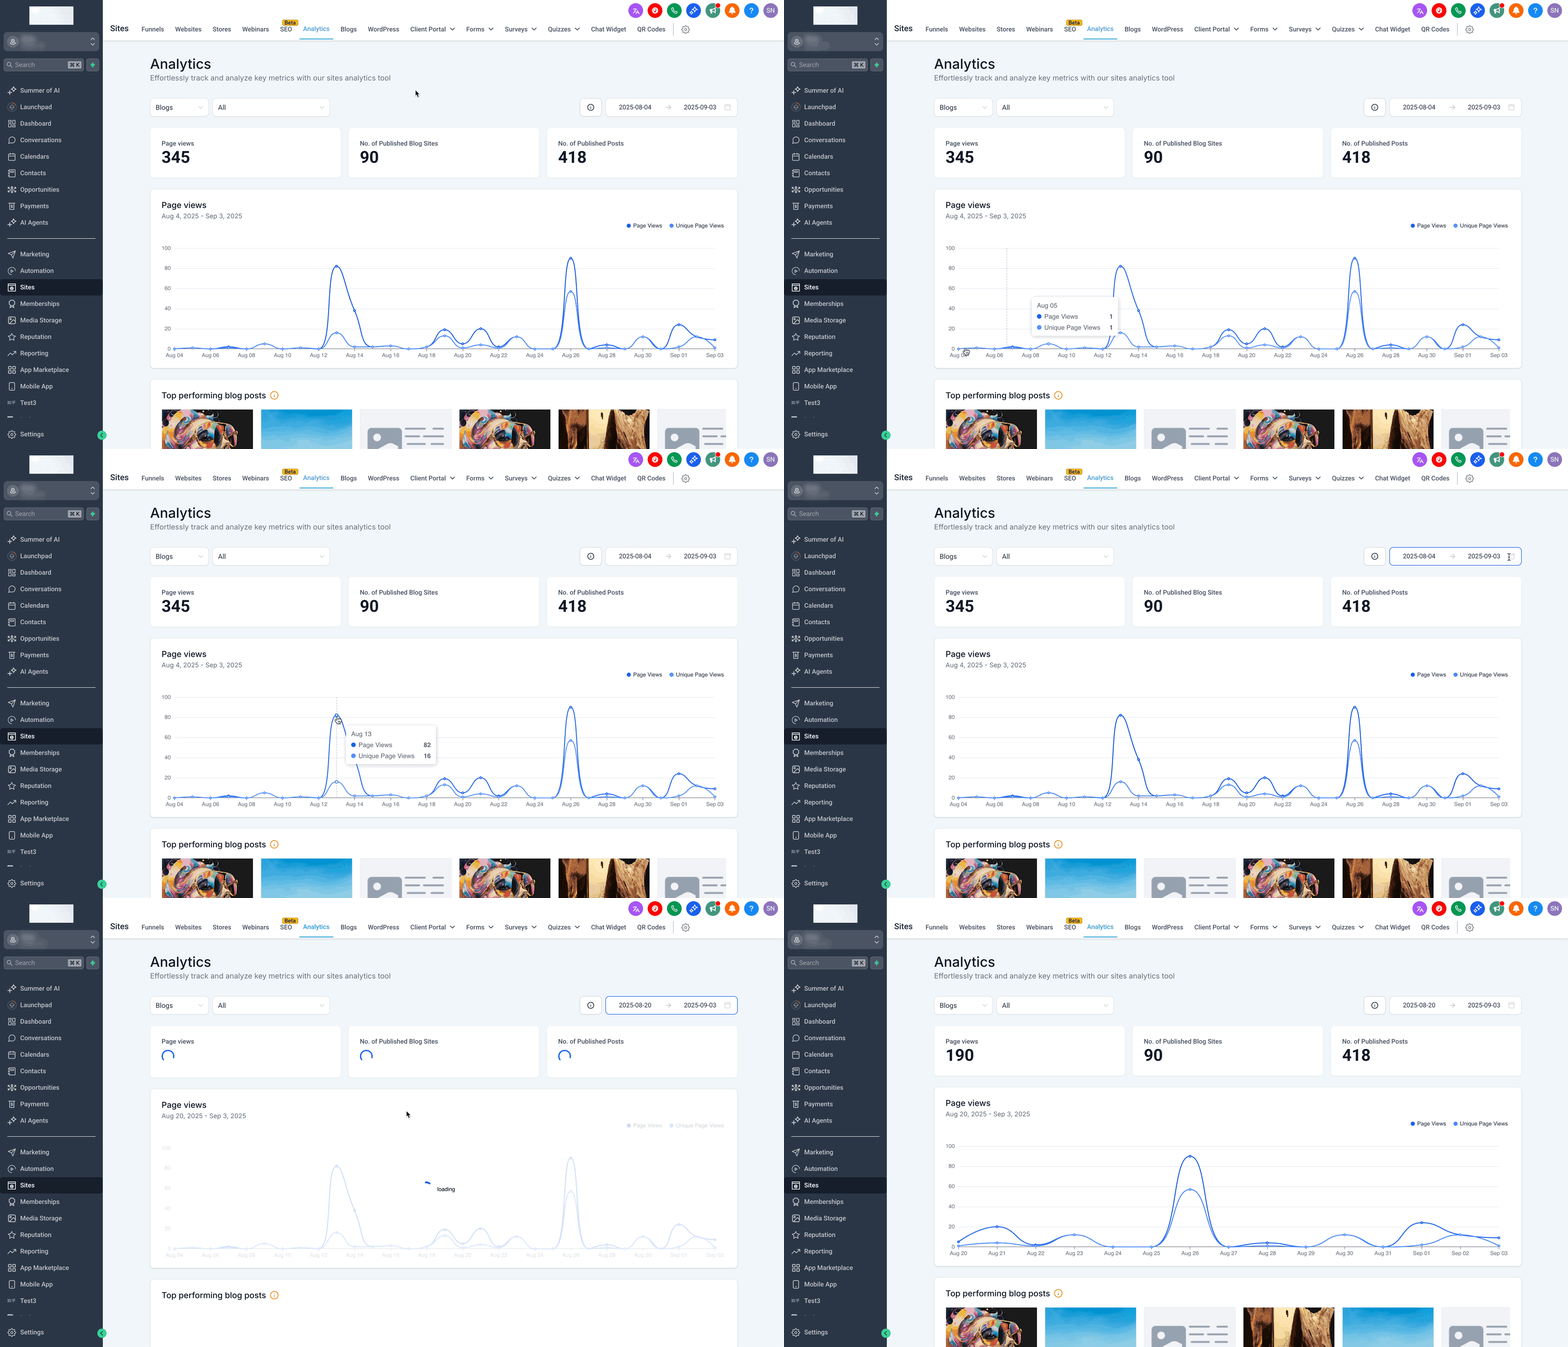
Trends Over Time
Trends Over Time enables you to monitor how your page views evolve across a chosen date range. The clear, interactive graphs help you identify seasonal trends, spikes, or dips in engagement, ensuring you can adjust your strategy as needed.
- Graphical representation of page views over time
- Flexible date range selection for custom insights
- Visual trend lines for quick analysis
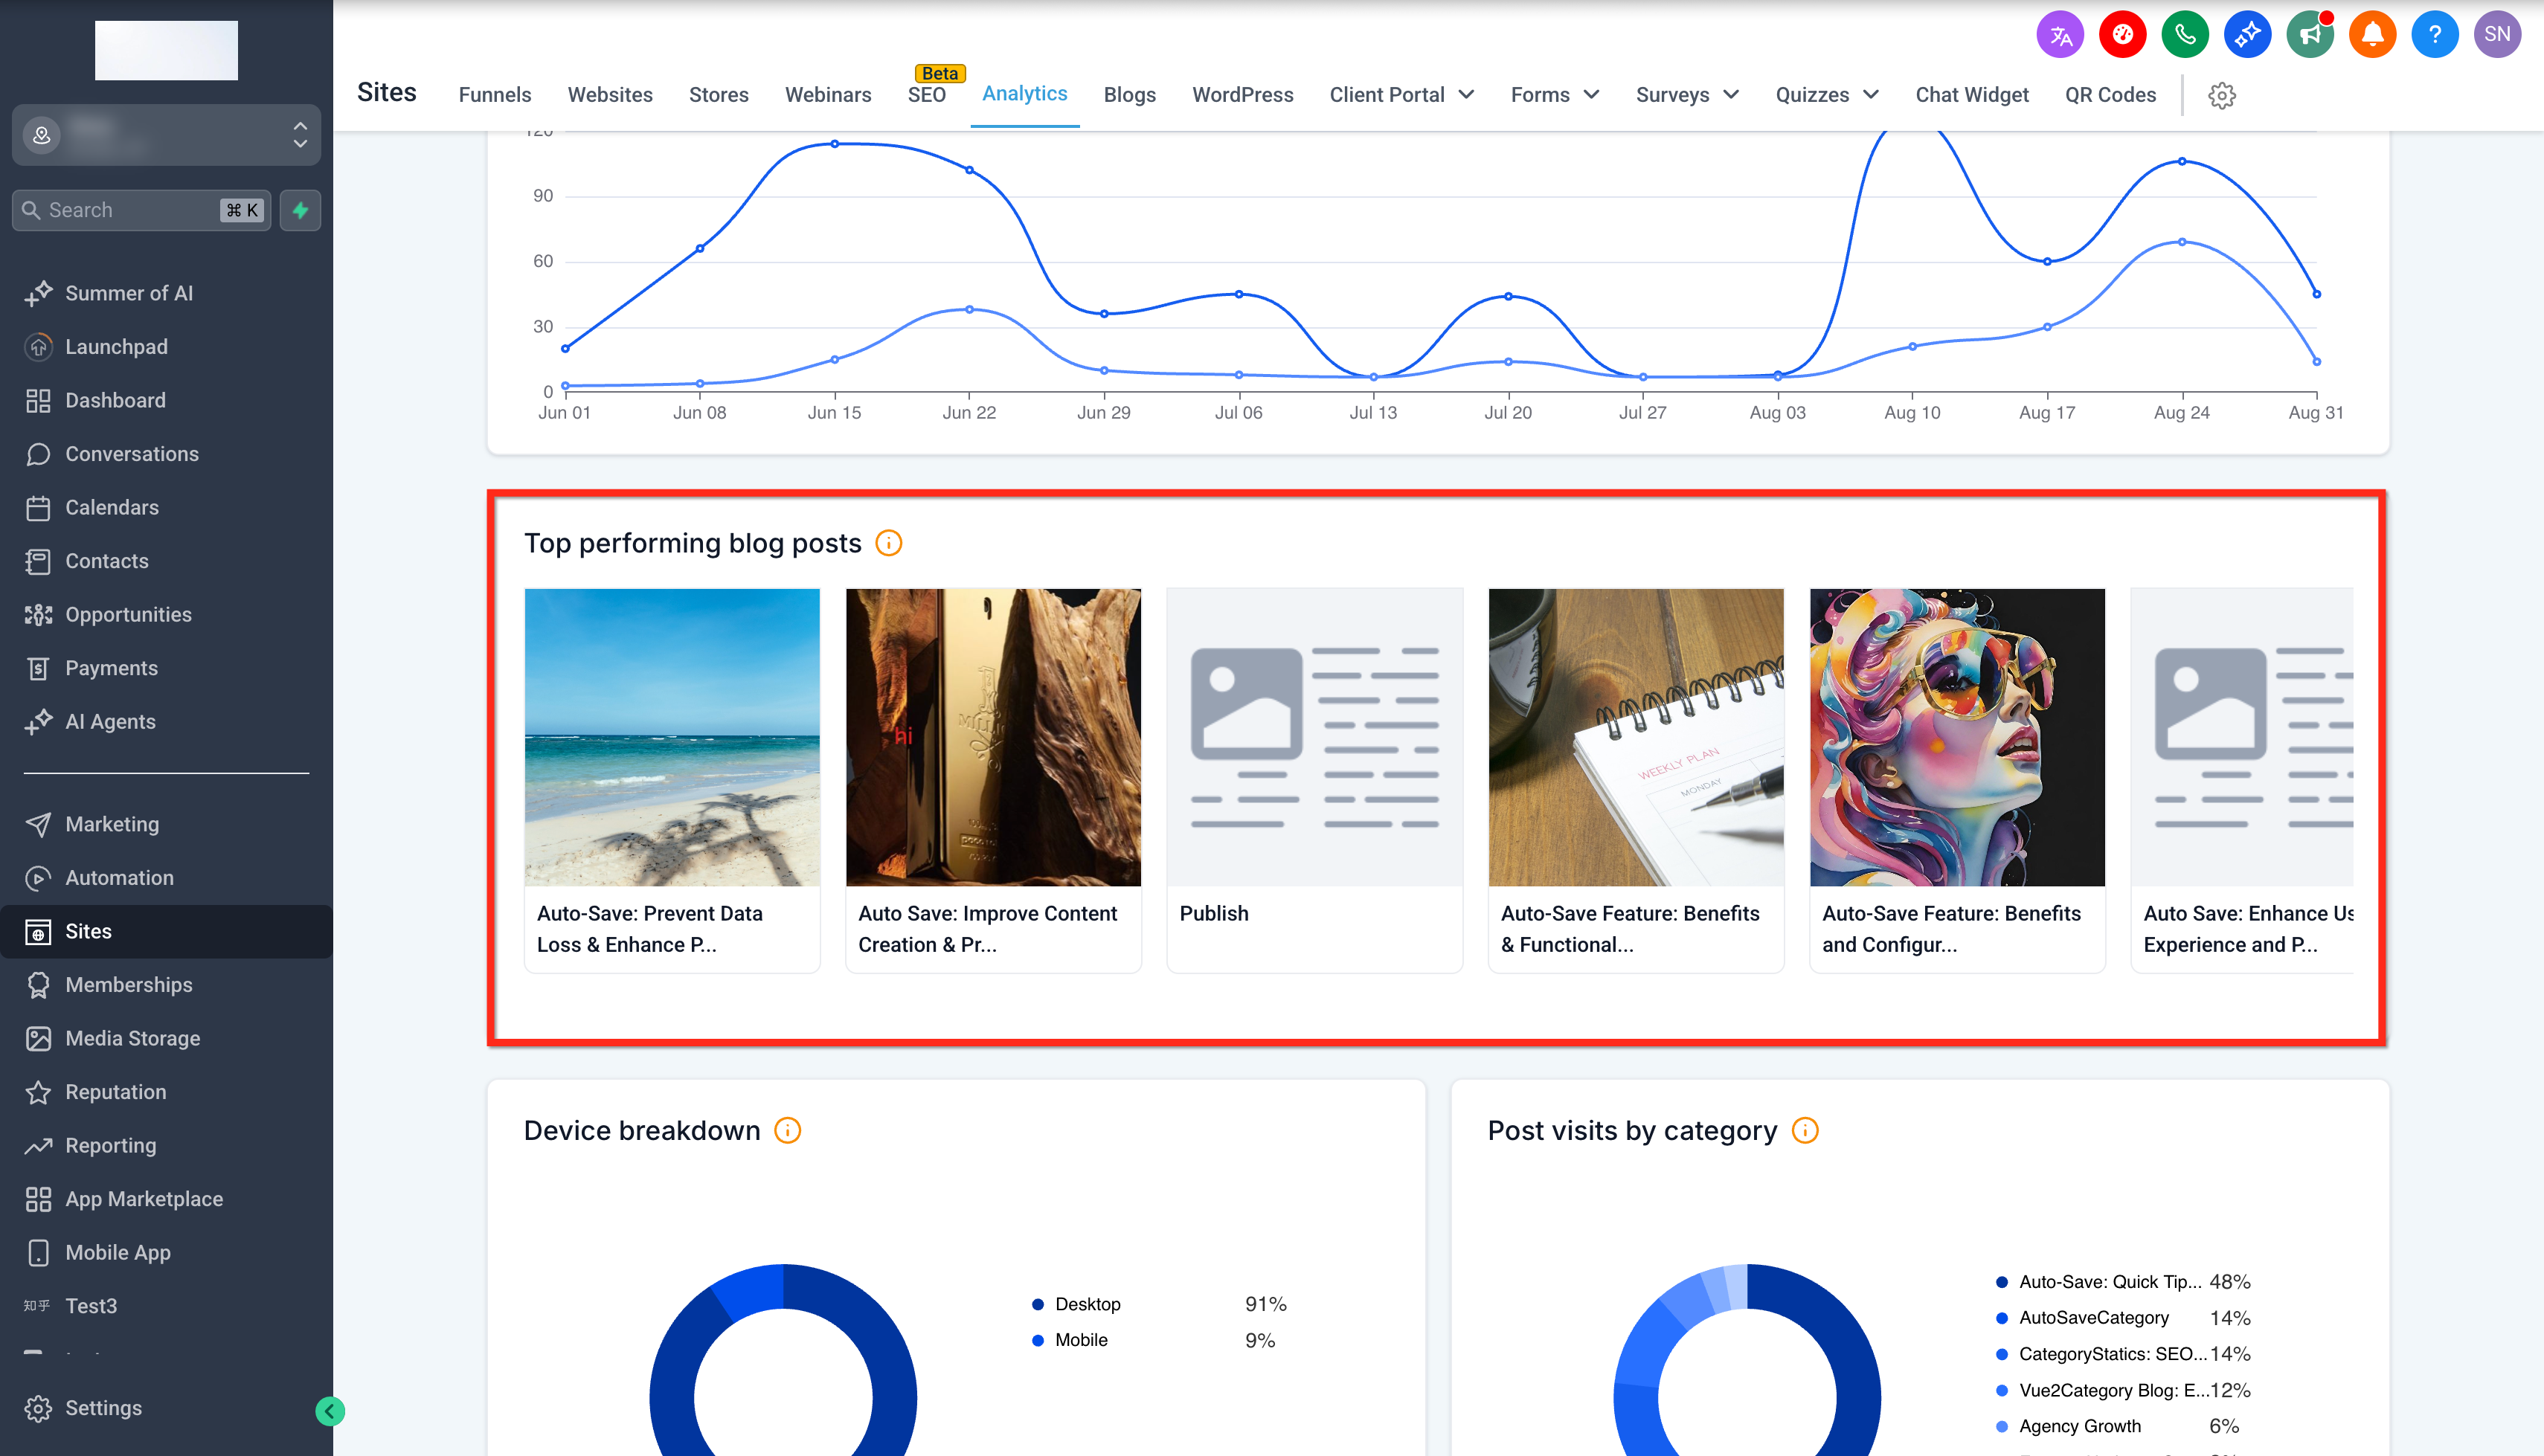
Top Performing Posts
Top Performing Posts spotlights your most engaging blog content by showing posts with the highest views and interaction rates. Featuring thumbnails and titles, this section lets you quickly identify content that resonates most with your audience.
- Displays thumbnails and titles for easy identification
- Ranks posts by view count and engagement
- Aids in recognizing content success factors
Number of Link Clicks
Link Click Tracking provides precise data on which in-post links garner clicks. This insight ensures that you can measure the effectiveness of call-to-actions and hyperlink placements within your blog content.
- Detailed count of clicks for each embedded link
- Visual cues to track active engagement points
- Supports data-driven content improvement decisions
Device Breakdown
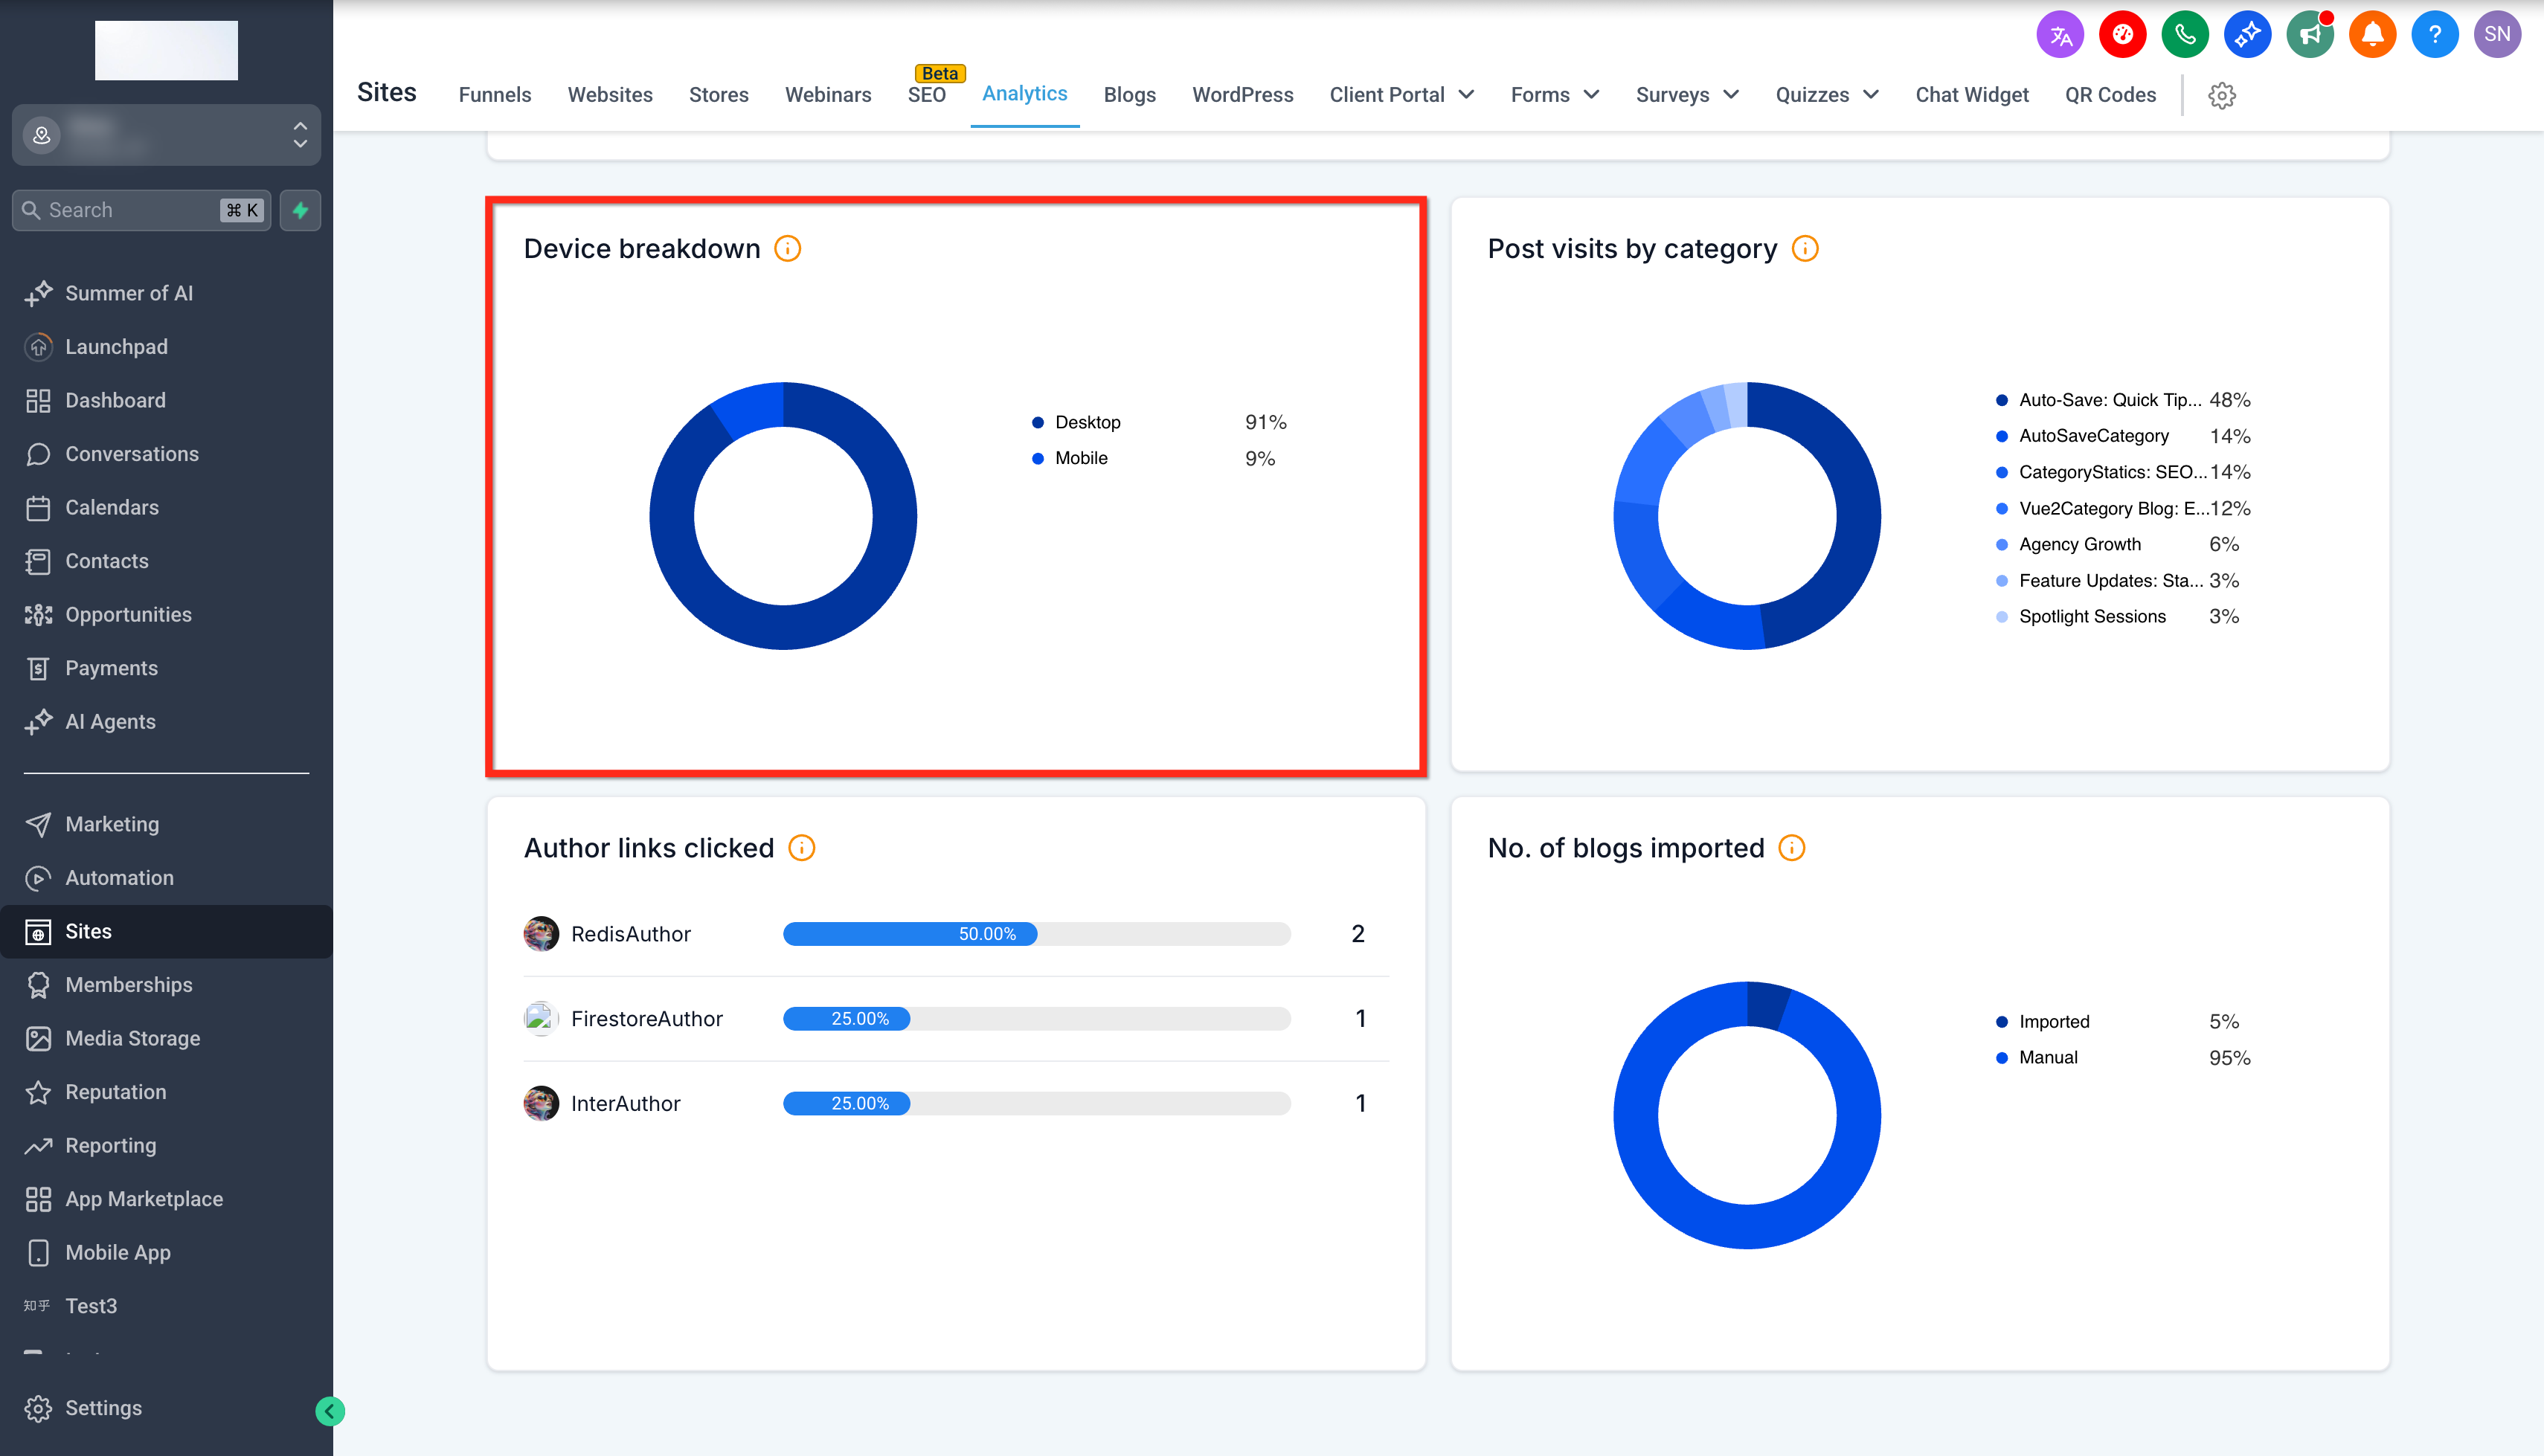
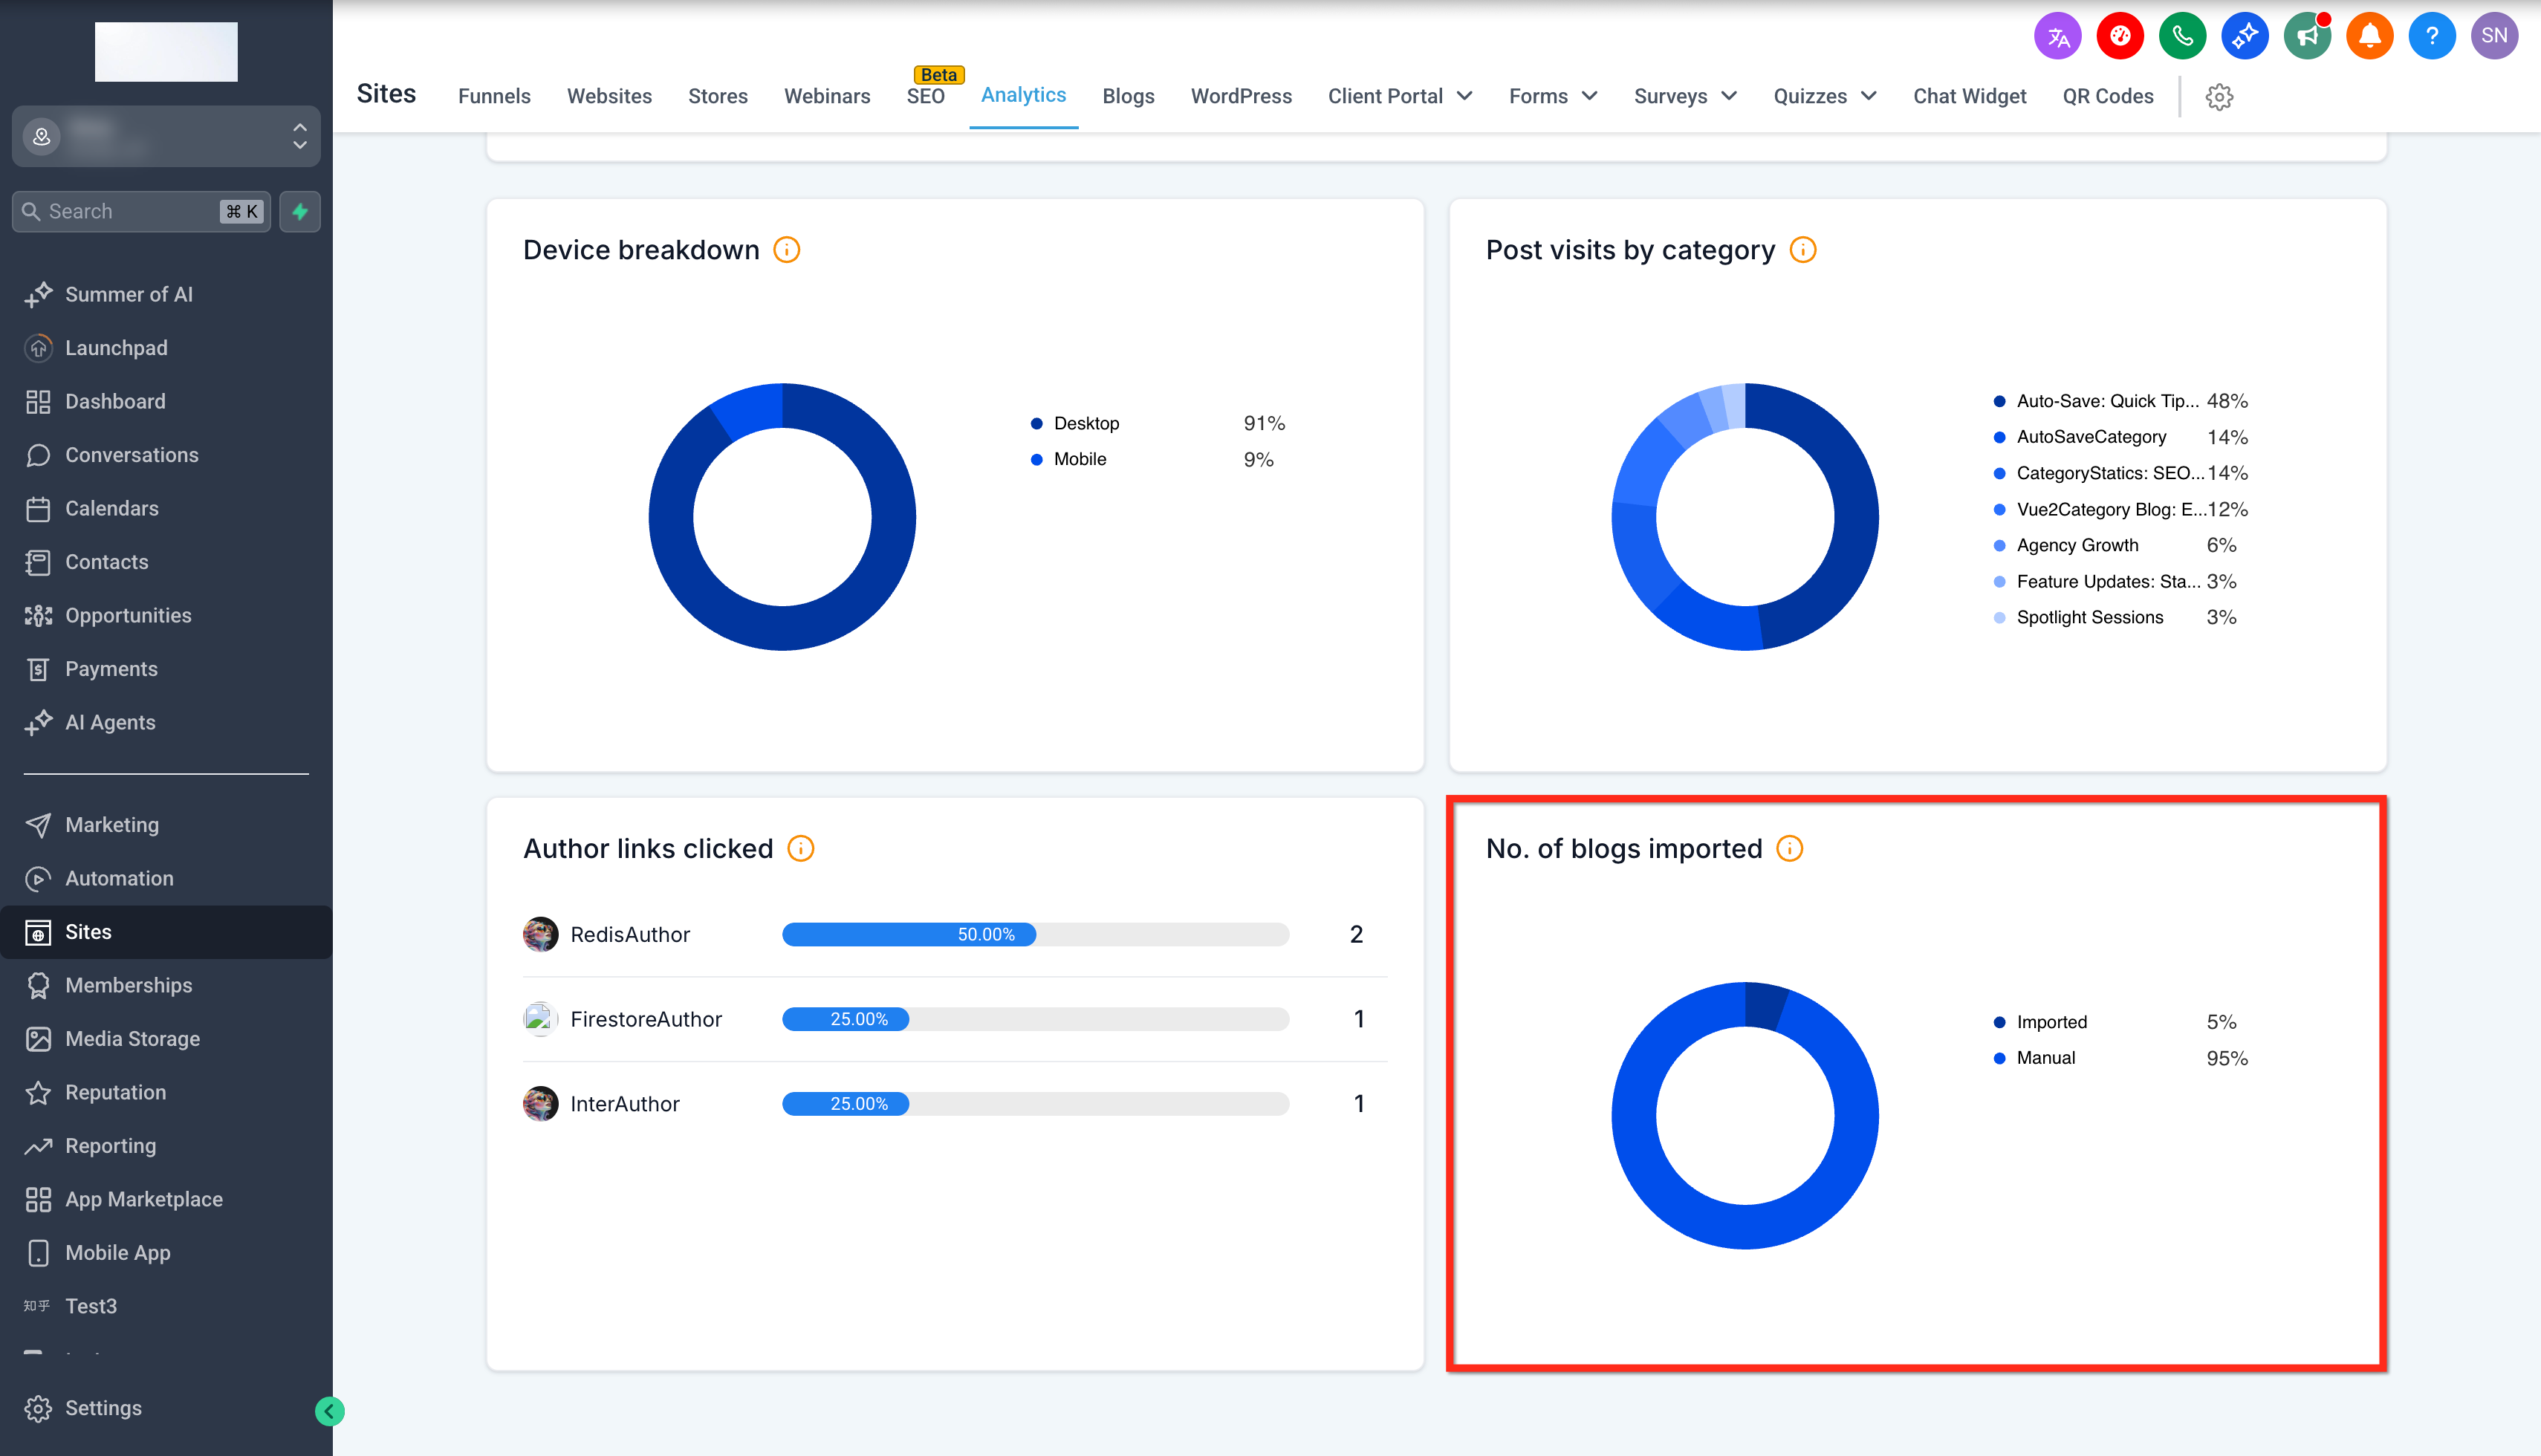
Device Breakdown informs you about the devices your audience uses to access your blog—be it desktops, mobiles, or tablets. This information is crucial for optimizing the user experience across different platforms and ensuring accessibility.
- Segmentation of views by device (desktop, mobile, tablet)
- Insights to help tailor content for each device type
- Empowers responsive design and platform-specific adjustments
Post Visits by Category
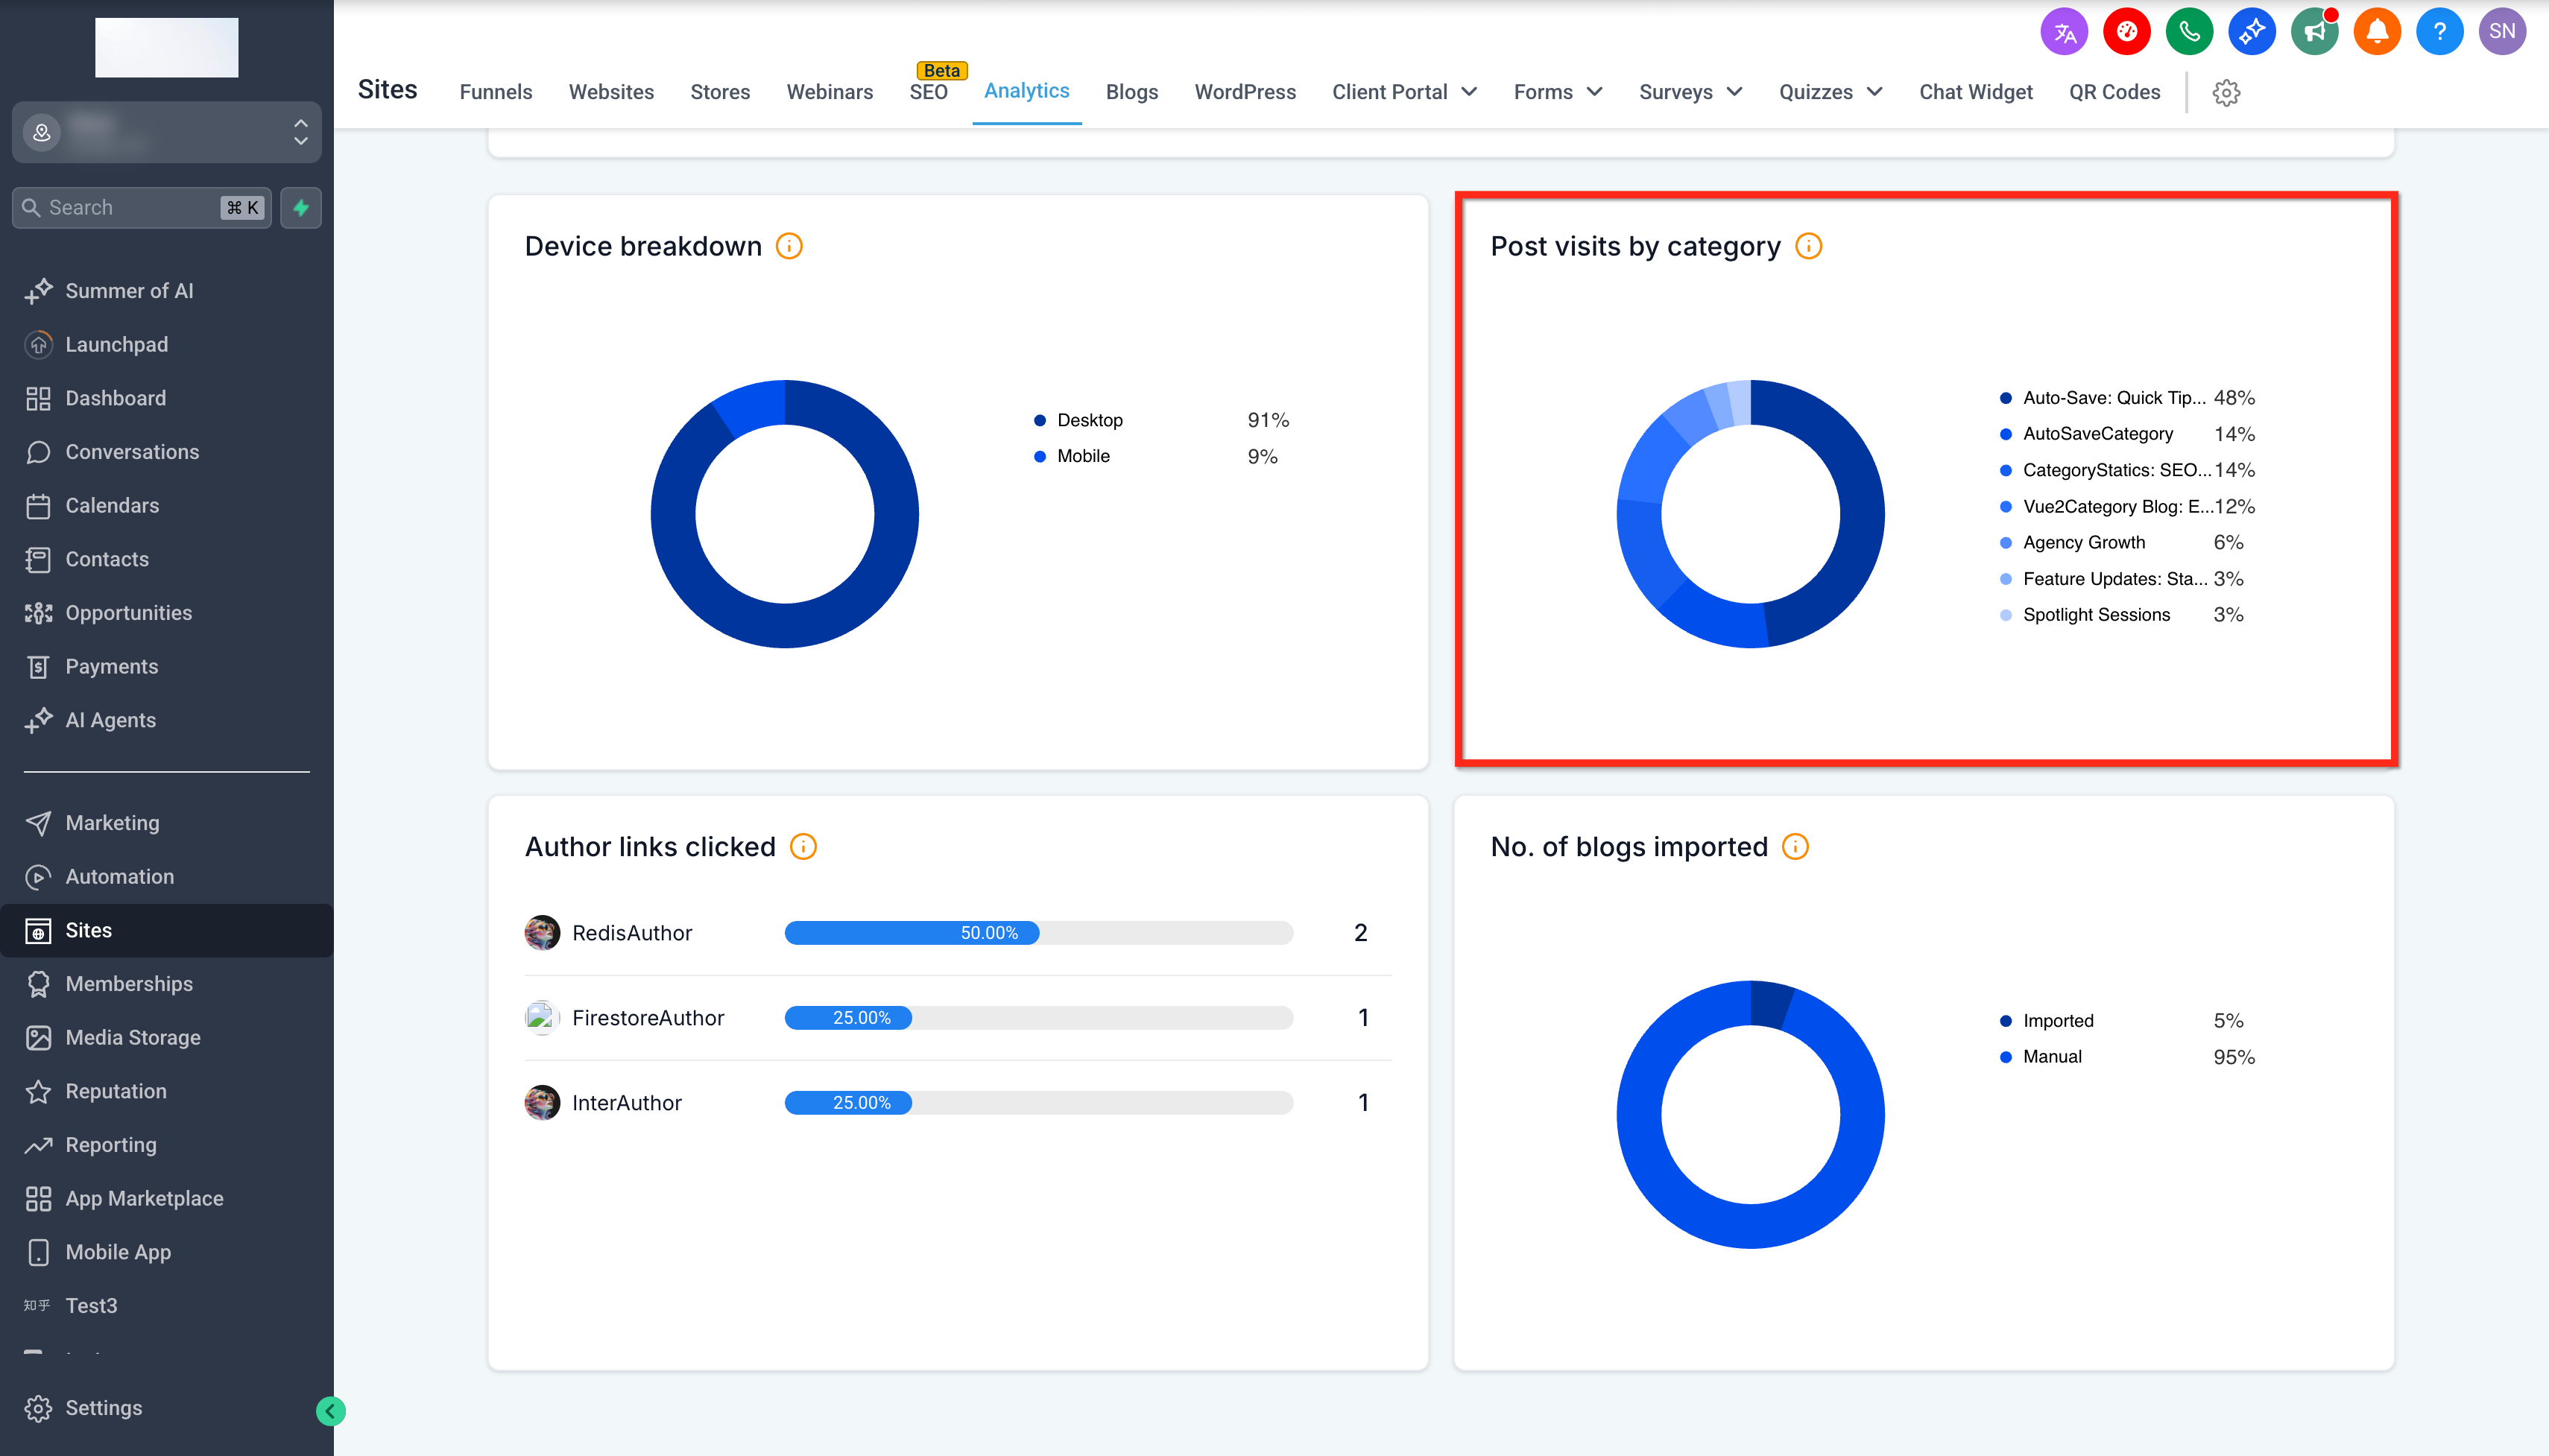
Category Insights segment post visits by their respective content categories. This feature enables you to understand which topics or themes are generating the most interest, allowing for more targeted content planning.
- Displays visit counts split by content category
- Helps identify subject areas with strong audience appeal
- Supports strategic improvements in content targeting
Author Links Clicked
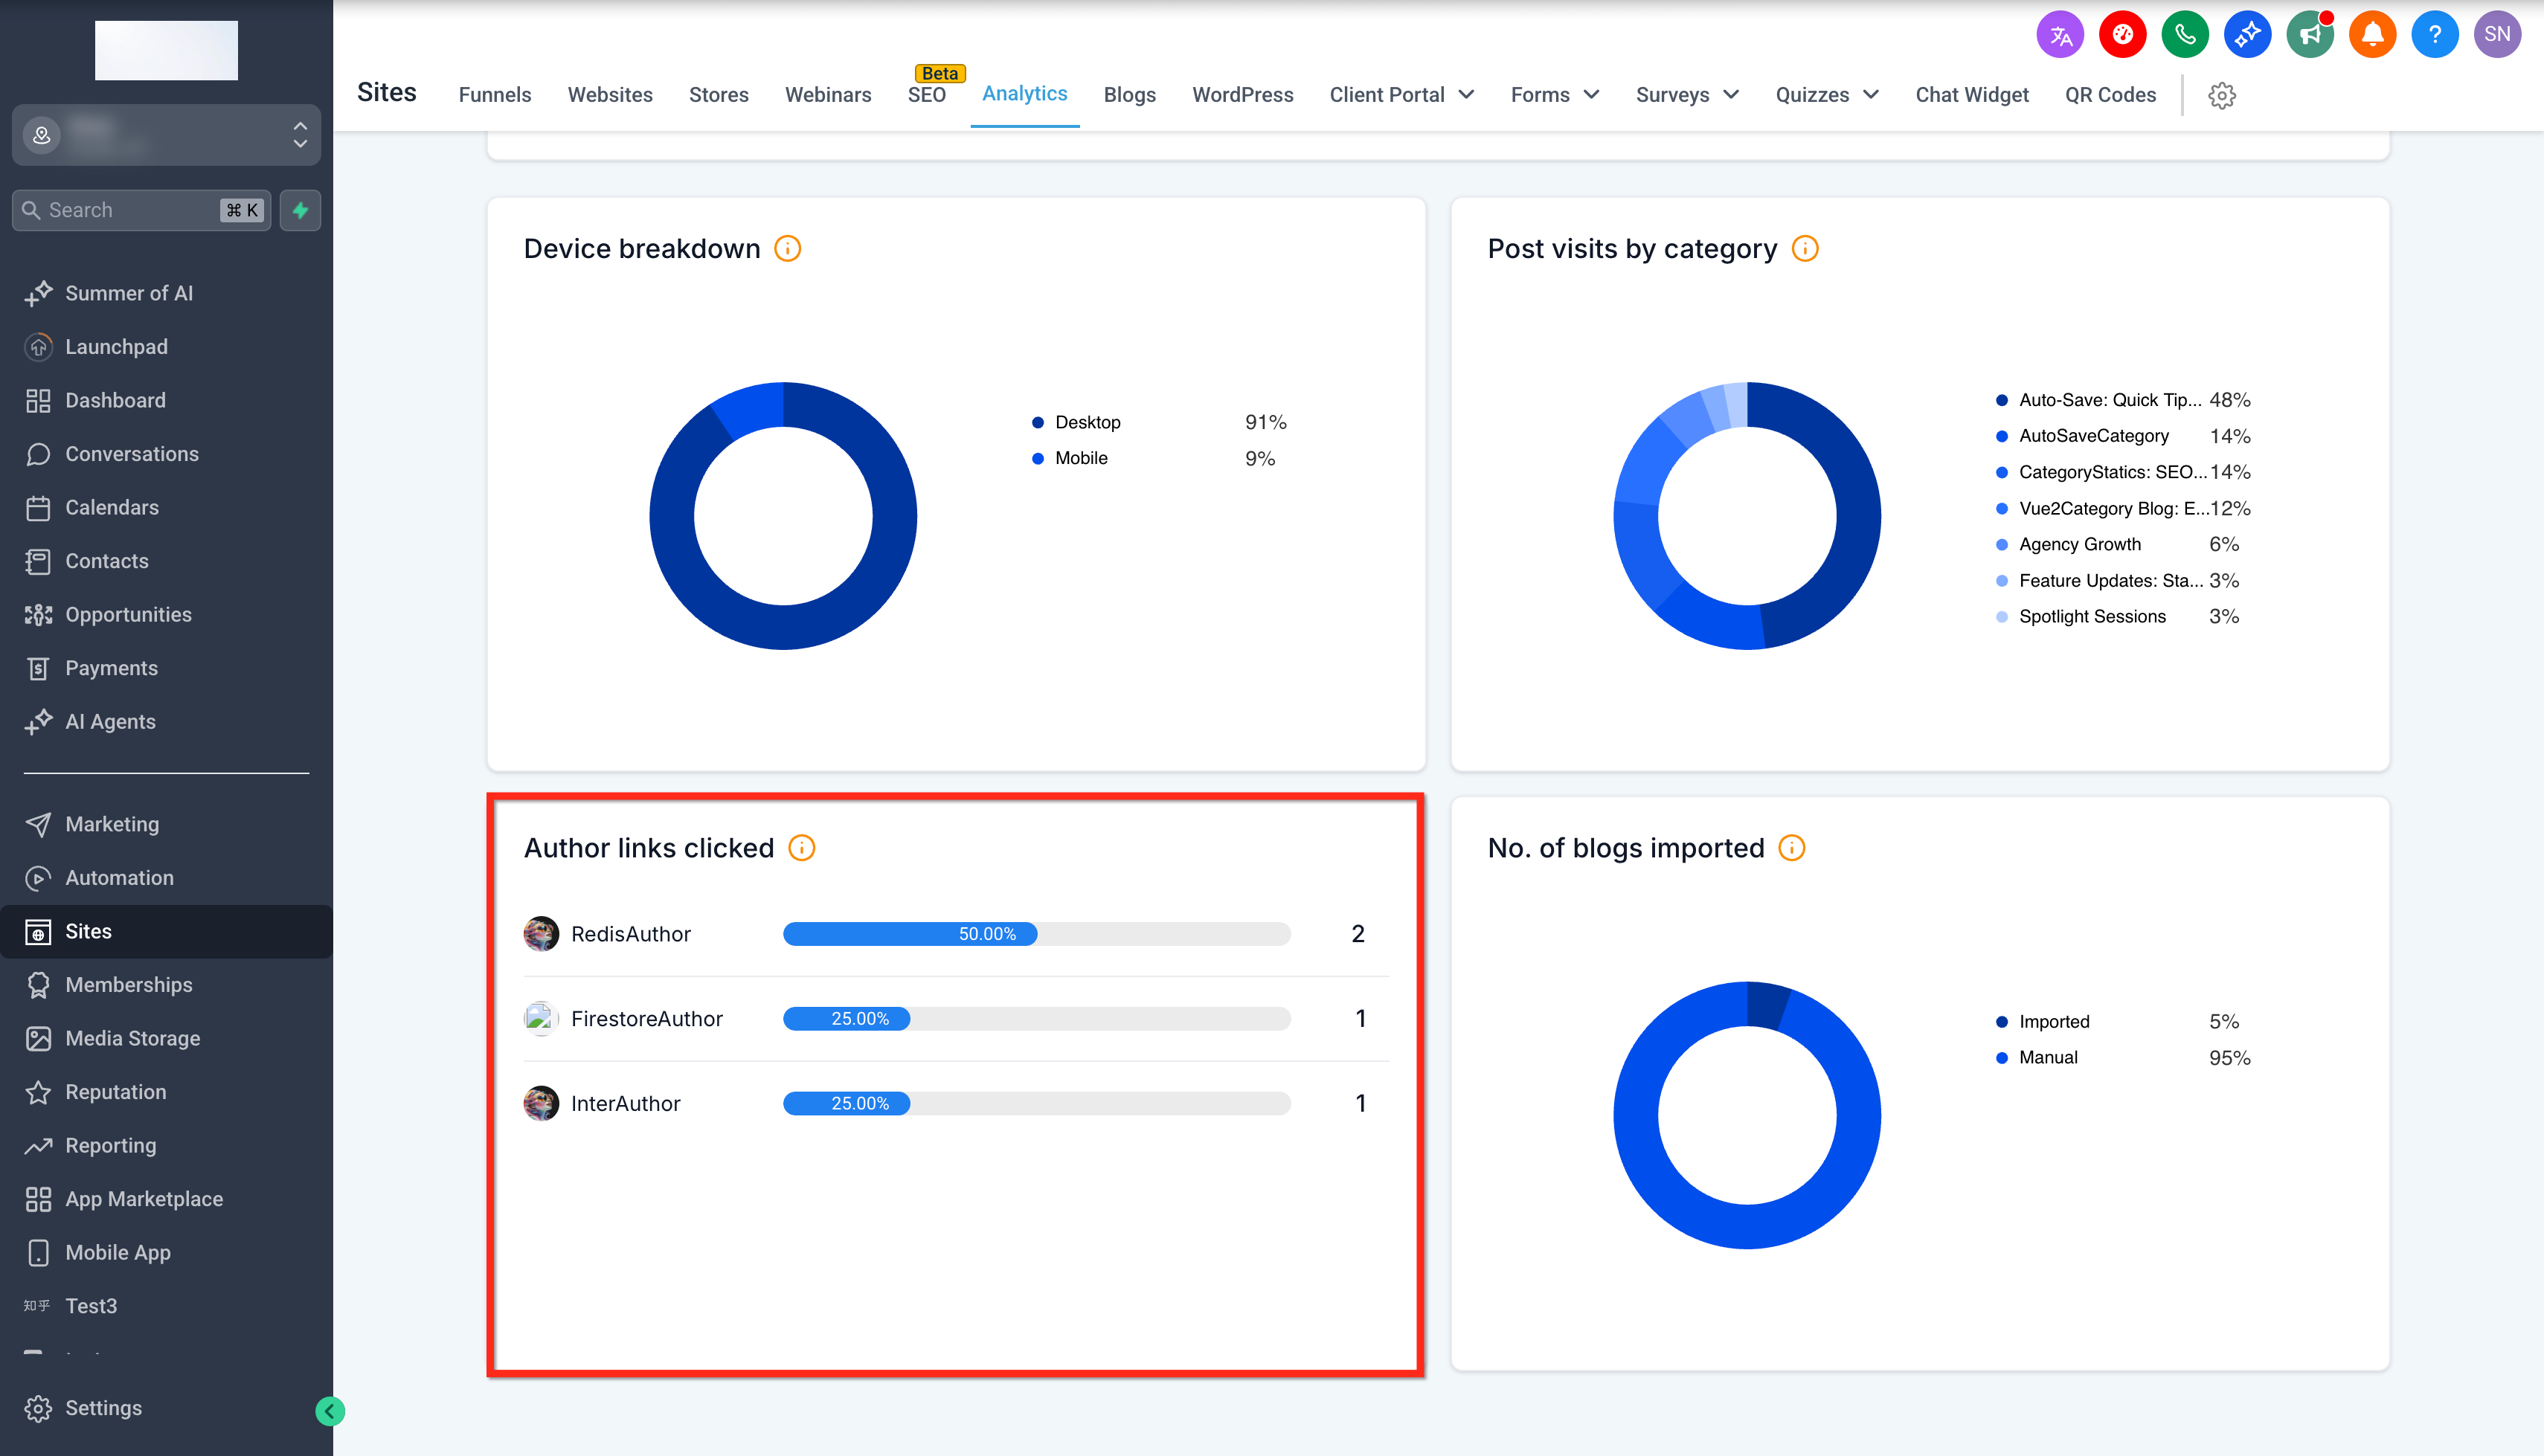
Author Insights track clicks on author links, illuminating which contributors are driving engagement. This data can be used to celebrate high performers or guide collaborative content strategies.
- Monitors engagement through author link clicks
- Provides feedback on individual contributor performance
- Drives data-backed decisions in content collaboration
Import vs. Manual Tracking
Import vs. Manual Tracking distinguishes between posts that were imported and those created manually. This comparison lets you evaluate the performance differences between various content creation methods, helping you refine your posting strategies.
- Offers insight into content creation methods
- Highlights performance disparities between imported and manually created posts
- Supports decision-making regarding content curation techniques
Frequently Asked Questions
Q: Who can access Blog Analytics?
Blog Analytics are available to all users across all 3 plans.
Q: From when is the data available?
Blog Analytics are captured starting 28th Aug, 2024. Any blog activity before this date will appear as “Unknown” in reports.
Q: How can I filter data by date?
Use the date range selector to view data for your desired period.
Q: How do I identify which posts are most engaging?
The Top Performing Posts section uses thumbnails and titles to help you quickly spot posts with the highest engagement.
Q: Is the data updated in real time?
While the data is refreshed regularly, there may be a slight delay in real-time updates due to processing intervals.