
Monitor and boost your WordPress site’s speed and user experience—right inside SourCherry. The Website Performance Report summarizes PageSpeed Insights scores, surfaces Core Web Vitals, and organizes fixes by impact so you can prioritize what matters. Use it to diagnose slow pages, reduce bounce, and strengthen SEO signals without leaving the hosting dashboard.
TABLE OF CONTENTS
- What is the WordPress Website Performance Report?
- Key Benefits of the Website Performance Report
- How To Generate and Use the Website Performance Report
- Frequently Asked Questions
- Related Articles
What is the WordPress Website Performance Report?
The Website Performance Report is a built-in dashboard in SourCherry’s WordPress Hosting that evaluates how fast your pages load, how responsive they feel, and how stable layouts remain. It highlights issues that affect visitors the most and points you to practical improvements you can make from your existing WordPress setup.
The report analyzes published pages and returns separate mobile and desktop performance summaries. It reflects lab test results (from PageSpeed/Lighthouse) and emphasizes Google’s Core Web Vitals so you can make changes that improve real-user experience.
Key Benefits of the Website Performance Report
Benefits focus on faster load times, clearer prioritization, and better outcomes for conversions and search—while keeping your workflow inside SourCherry.
- Mobile vs. desktop clarity: See device-specific scores to find issues that only appear on phones or on larger screens.
- Core Web Vitals visibility: Track the three UX signals (LCP, INP, CLS) that matter most for perceived speed and stability.
- Prioritized health checks: Review items grouped as Passed, Consider, or Fix to know what deserves attention first.
- Actionable recommendations: Use plain-language explanations and estimated time-savings to guide the next best steps.
- SEO-aligned improvements: Optimize the technical factors that influence engagement and search performance.
- Dashboard-first workflow: Access insights from the WordPress Hosting dashboard—external tools remain optional.
How To Generate and Use the Website Performance Report
Follow these steps to locate the dashboard, switch device views, and interpret results.
Step 1: Open the WordPress Area
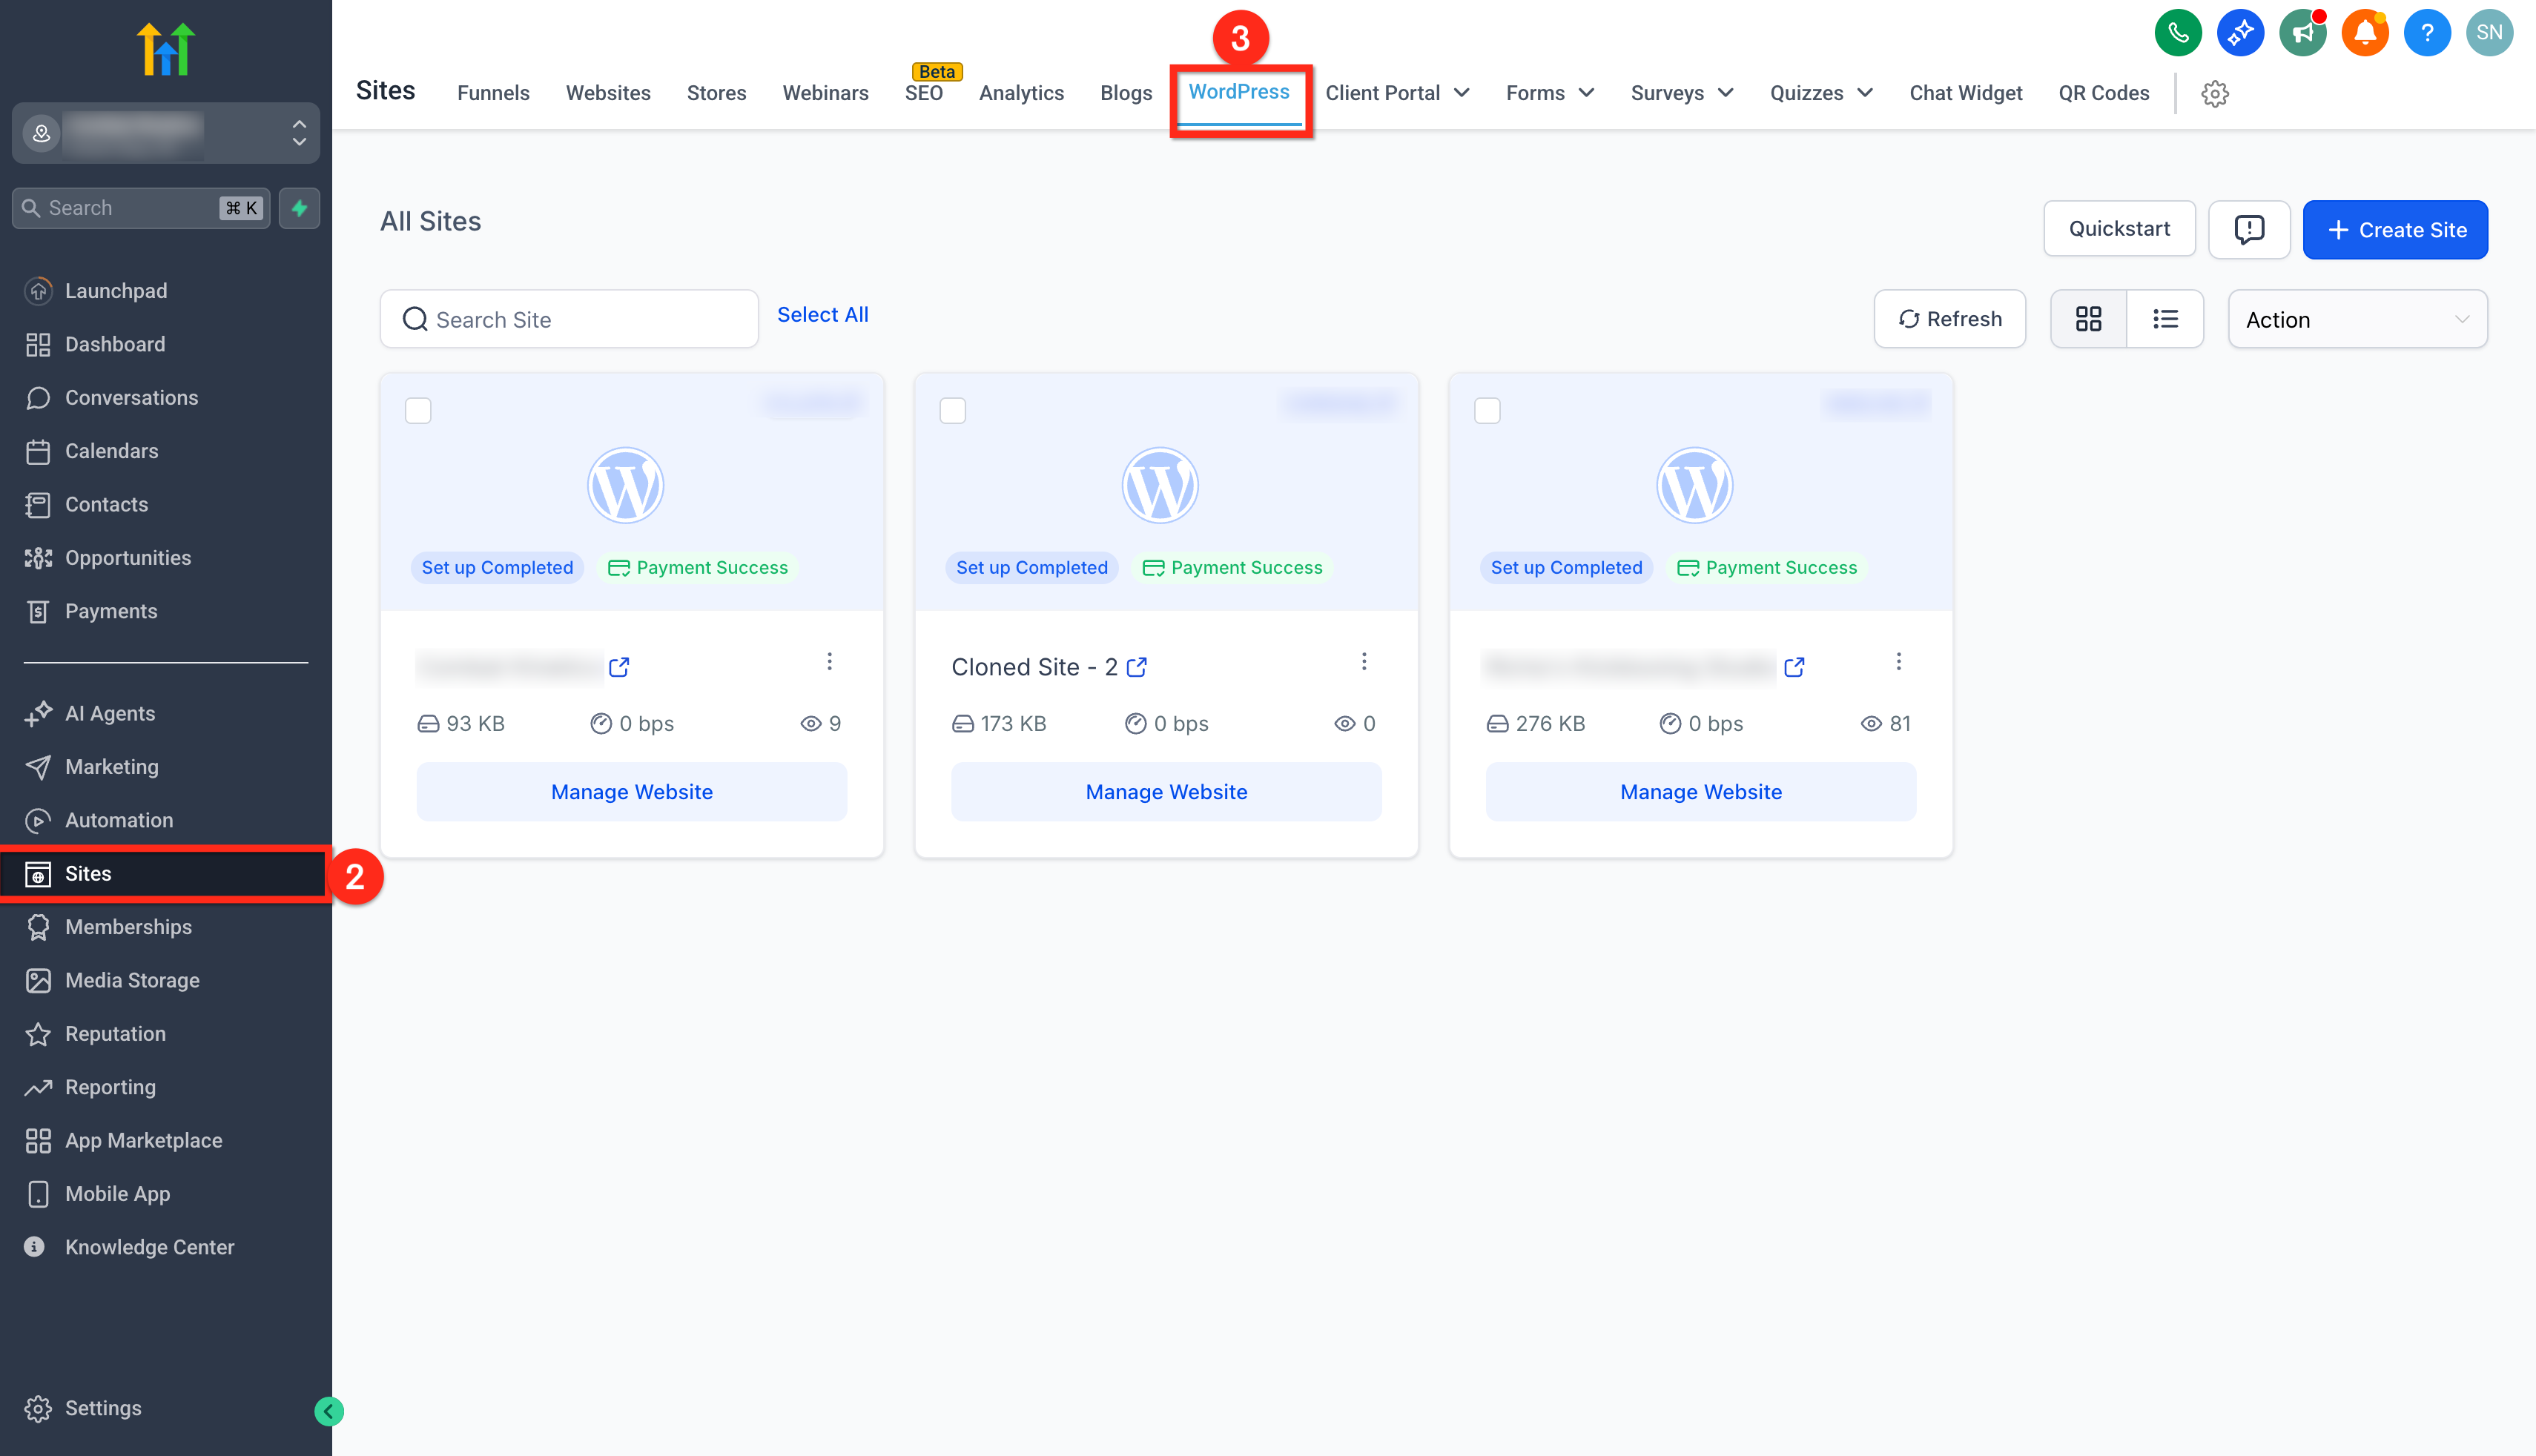
- Log in to your sub‑account.
- In the left sidebar, click Sites.
- Click WordPress.
Step 2: Open Site Management
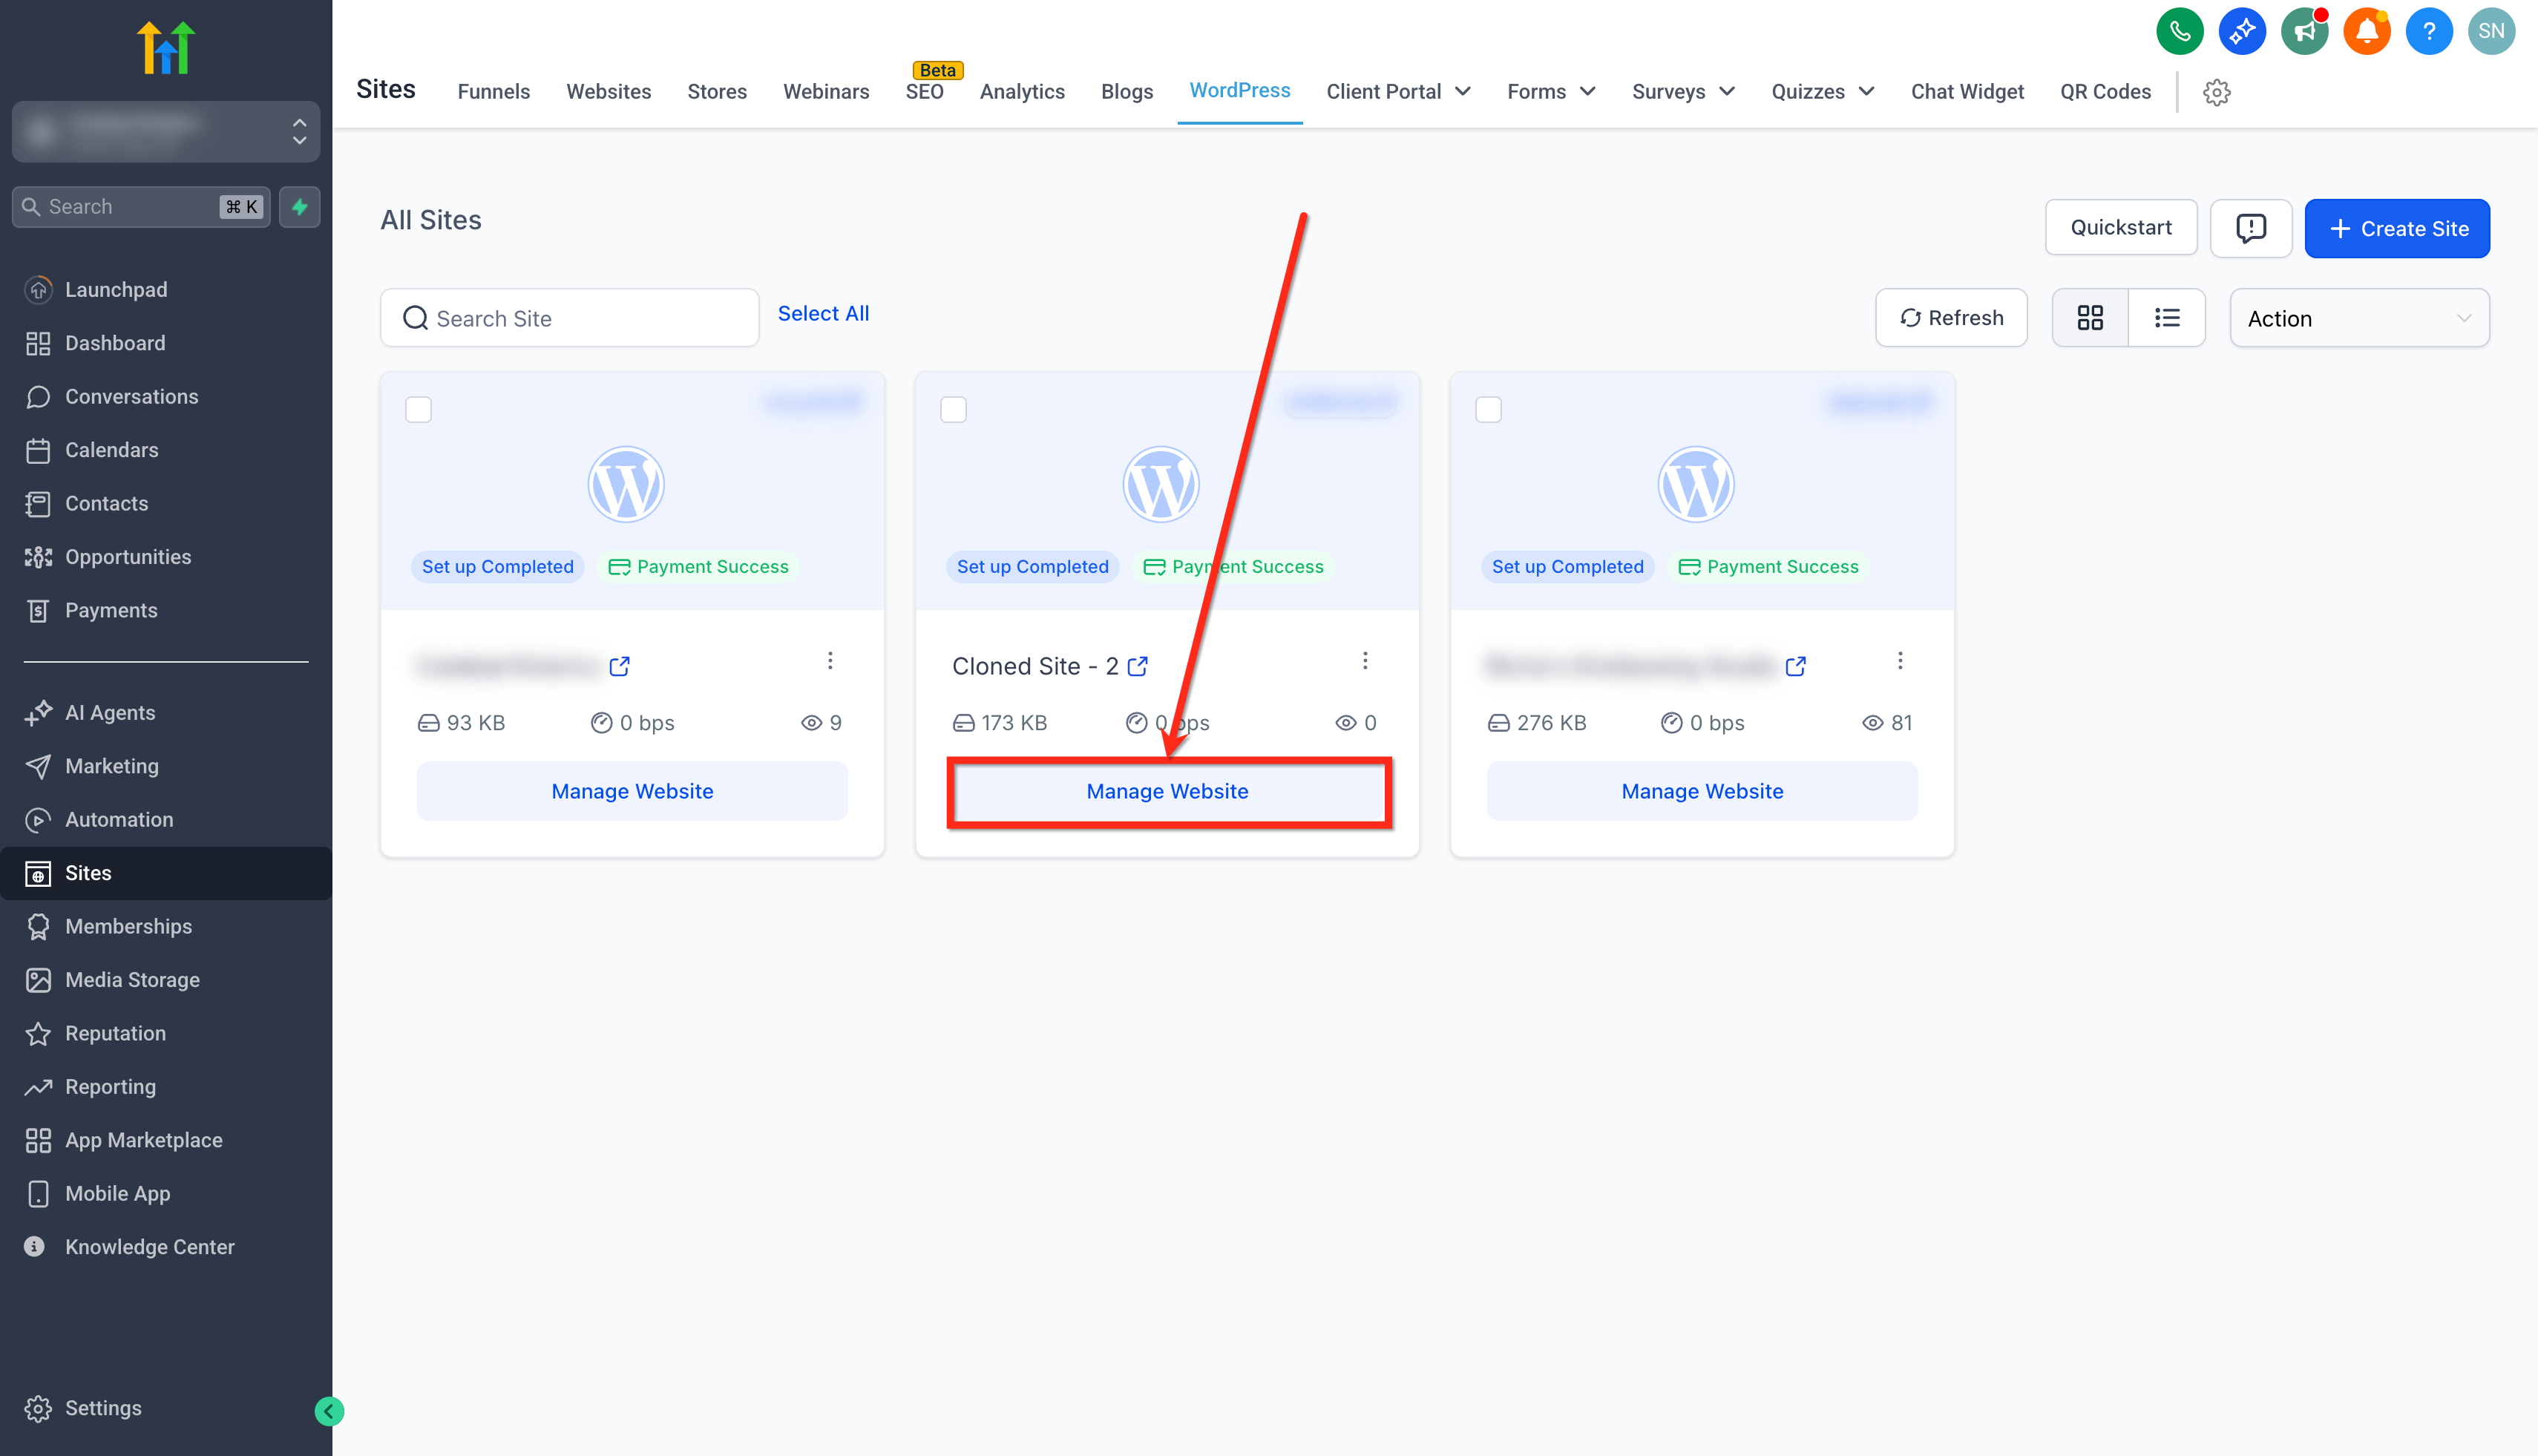
- On the WordPress site you want to analyze, click Manage Website.
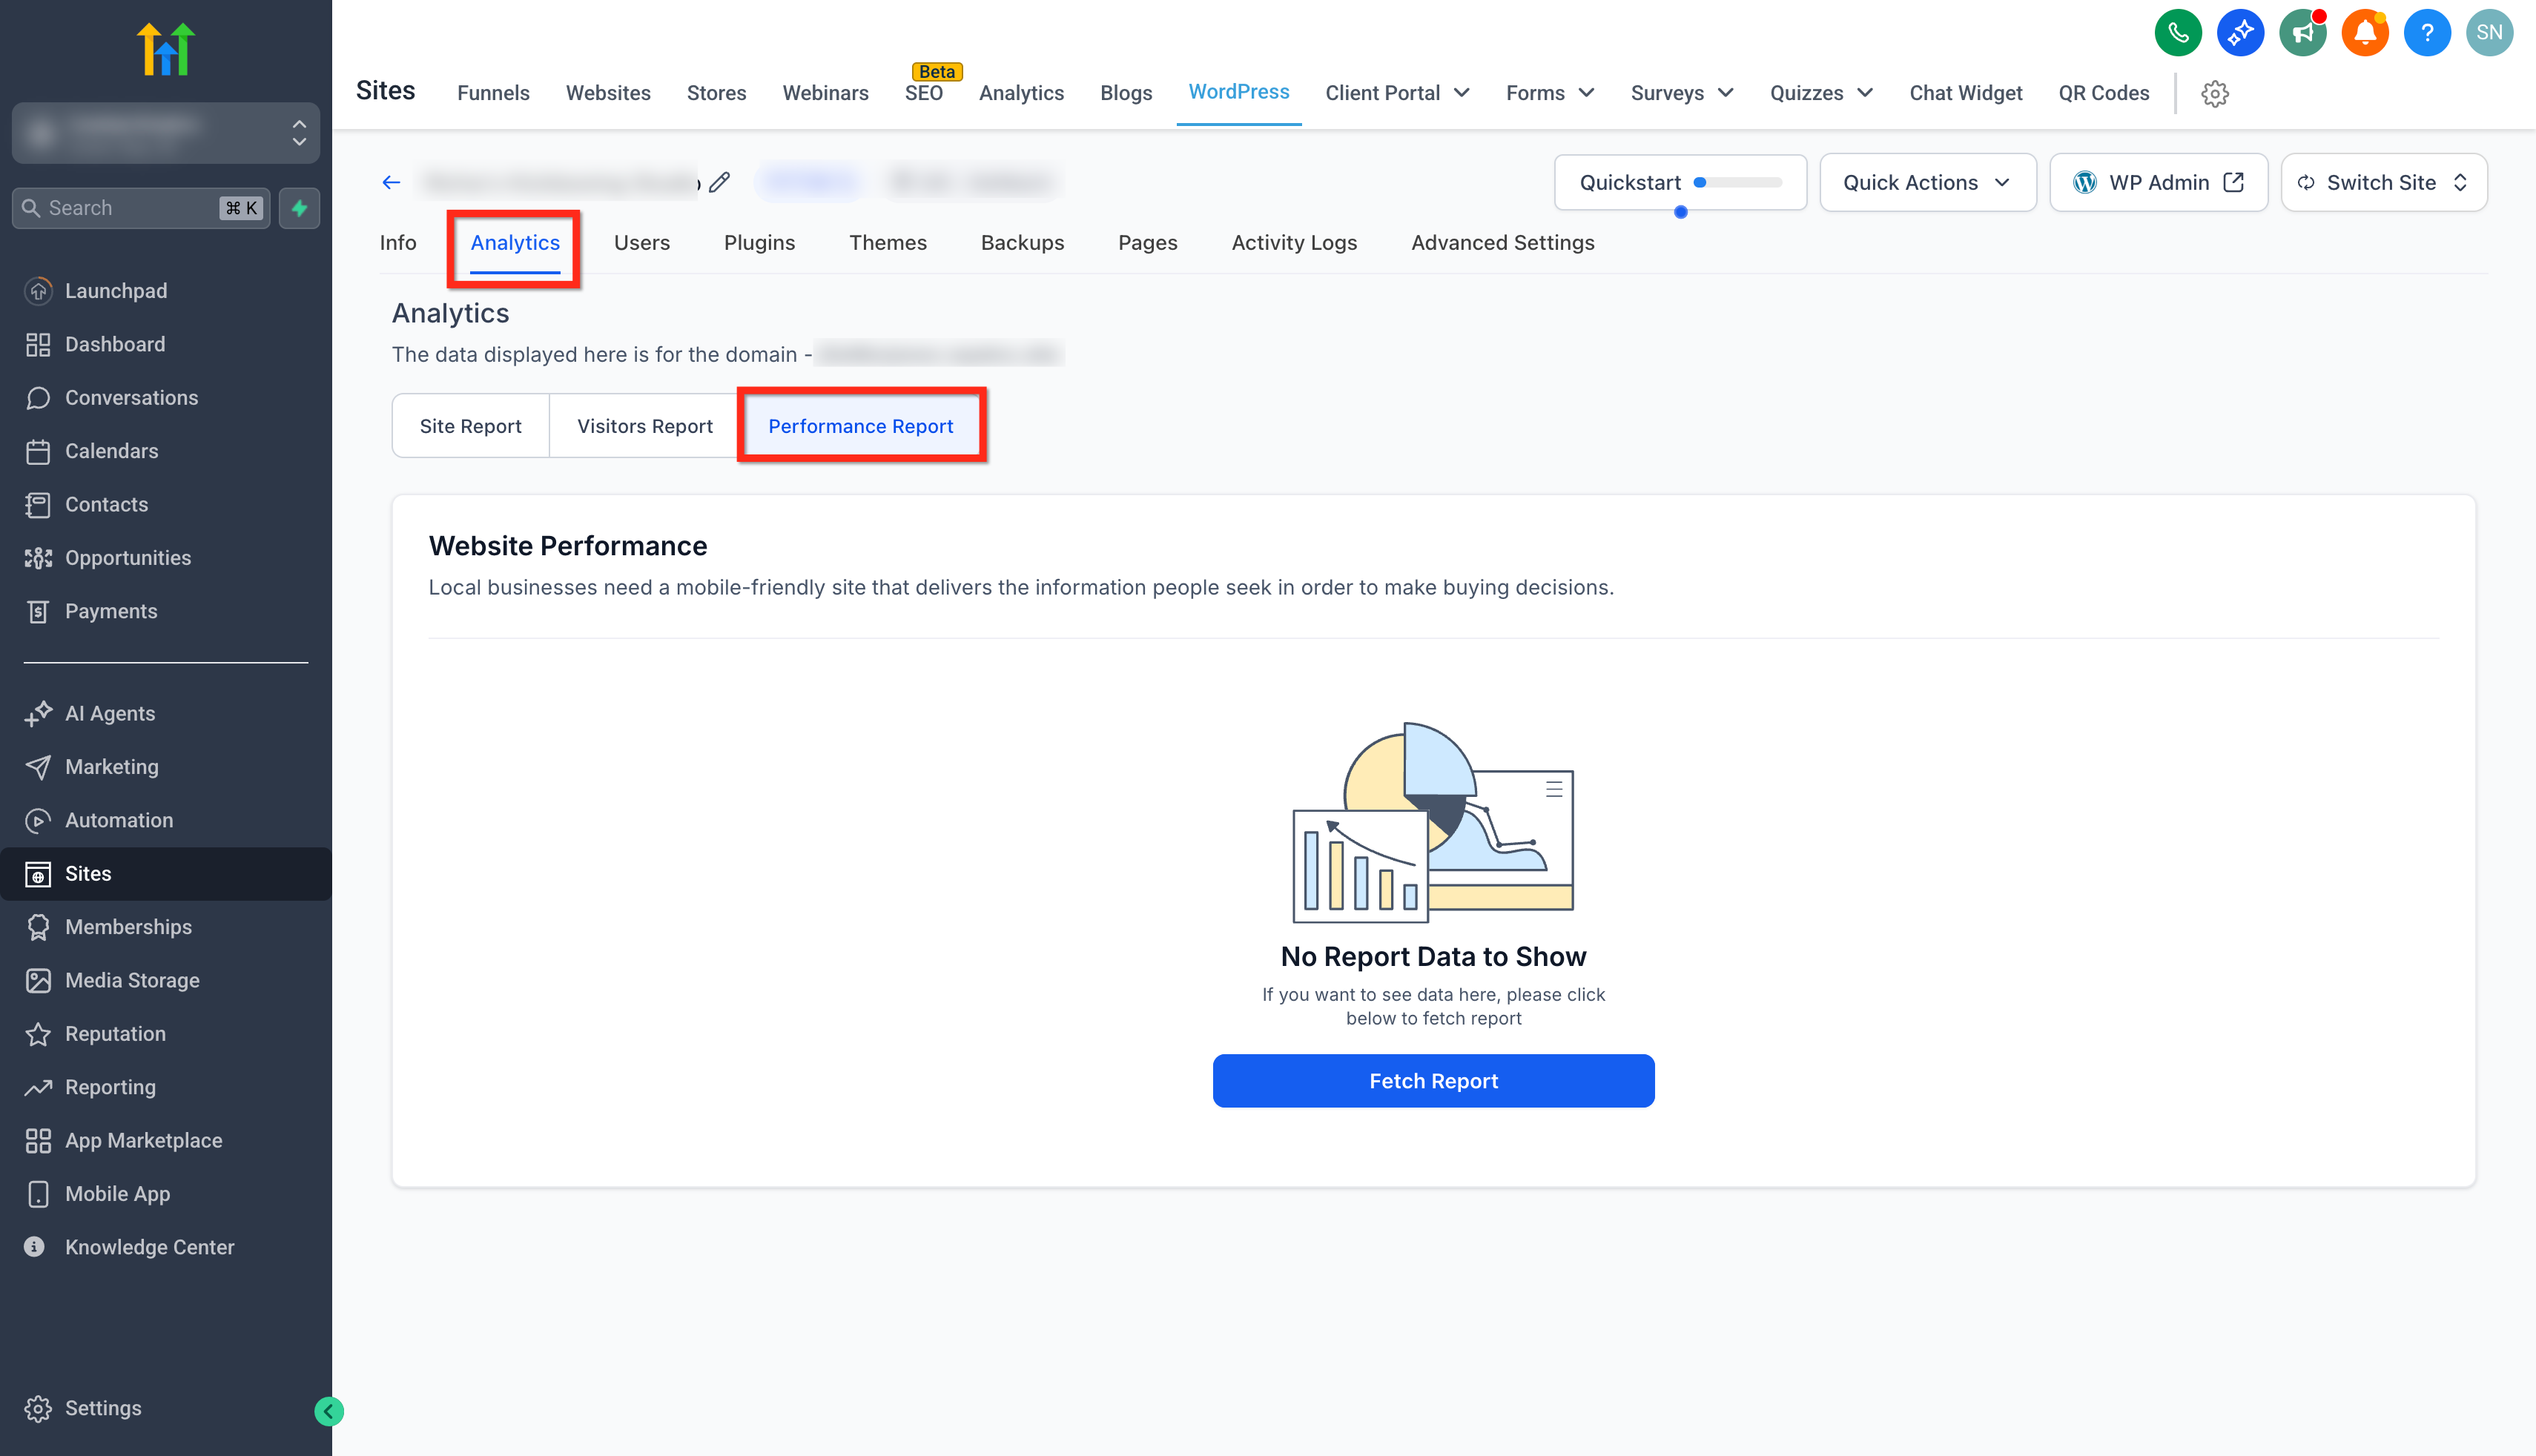
- Click the Analytics tab.
- Under Analytics, click Performance Reports.
Step 3: Generate Performance Report
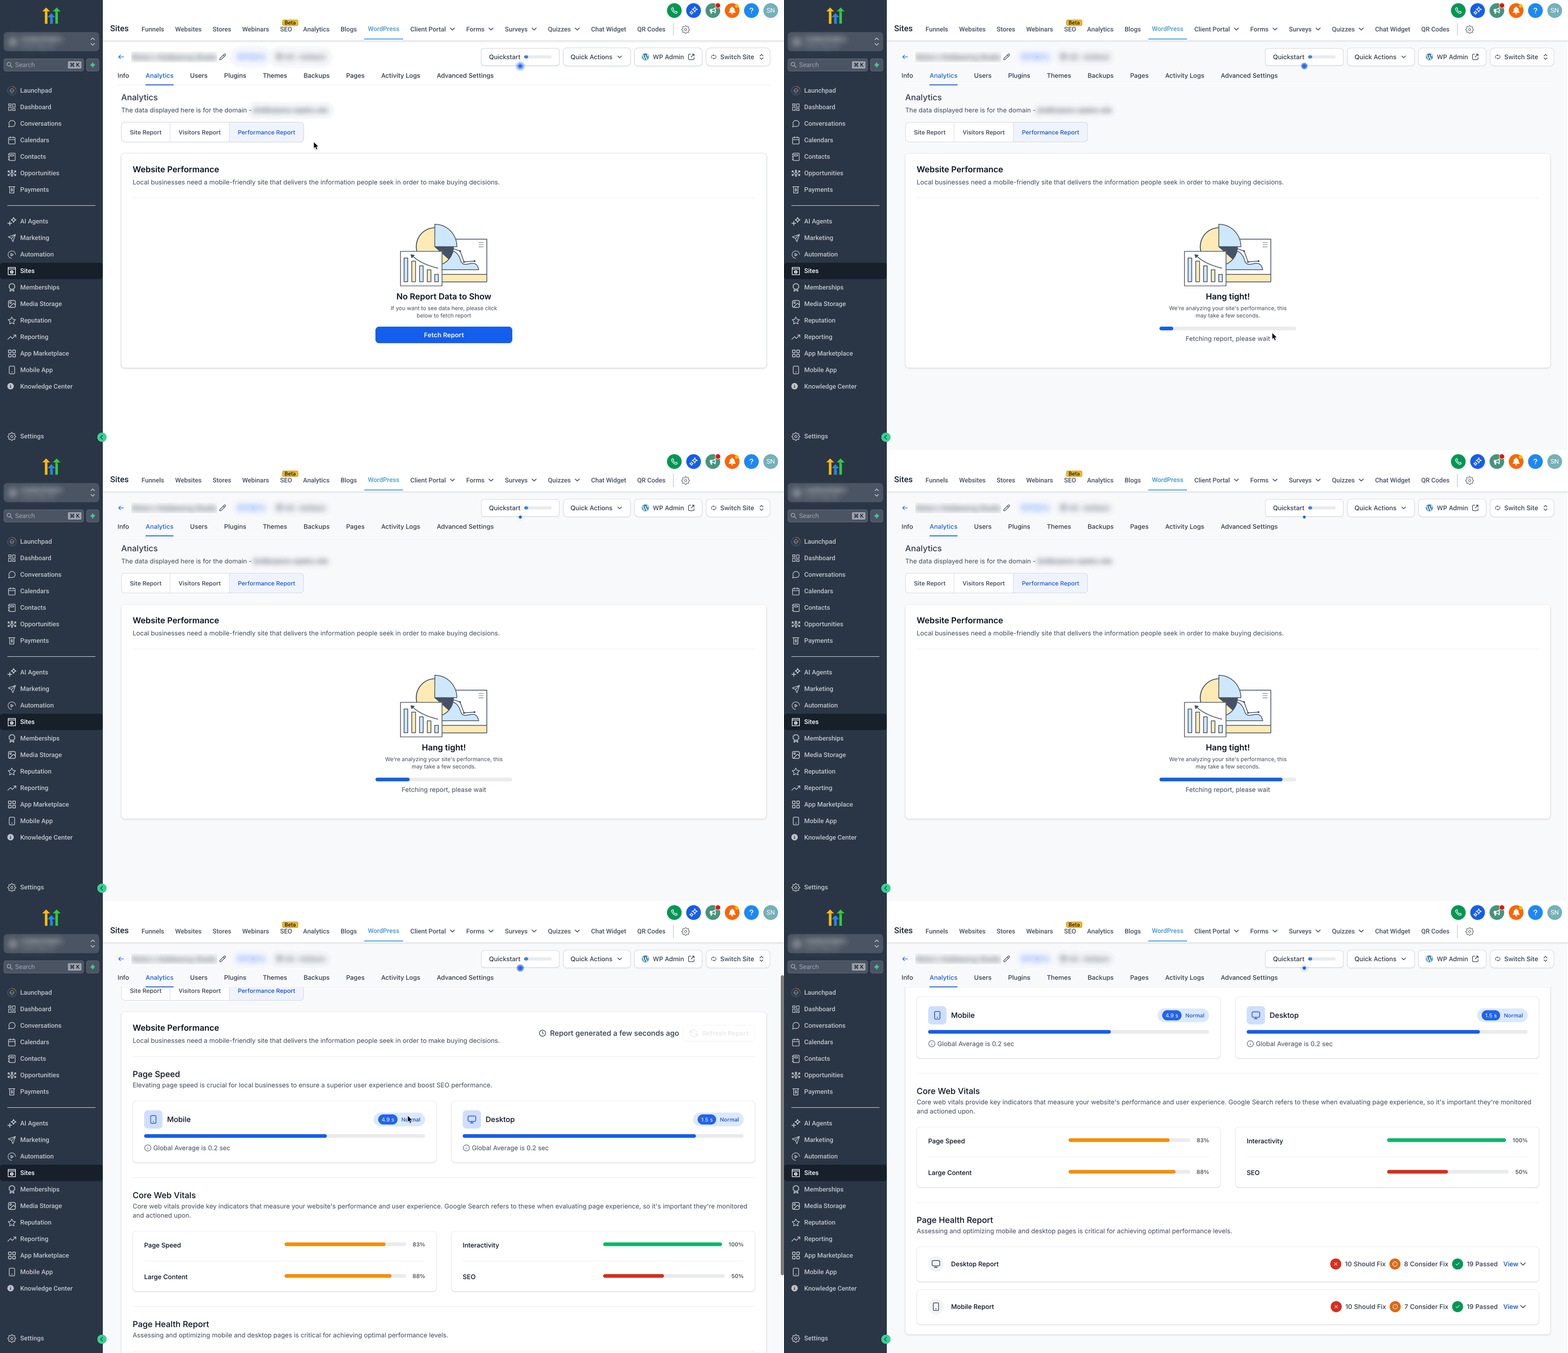
- Click Fetch Report.
- Wait while the report analyzes your site.
- The Website Performance Report renders with sections for Page Speed (Mobile & Desktop), Core Web Vitals, and Page Health Report.
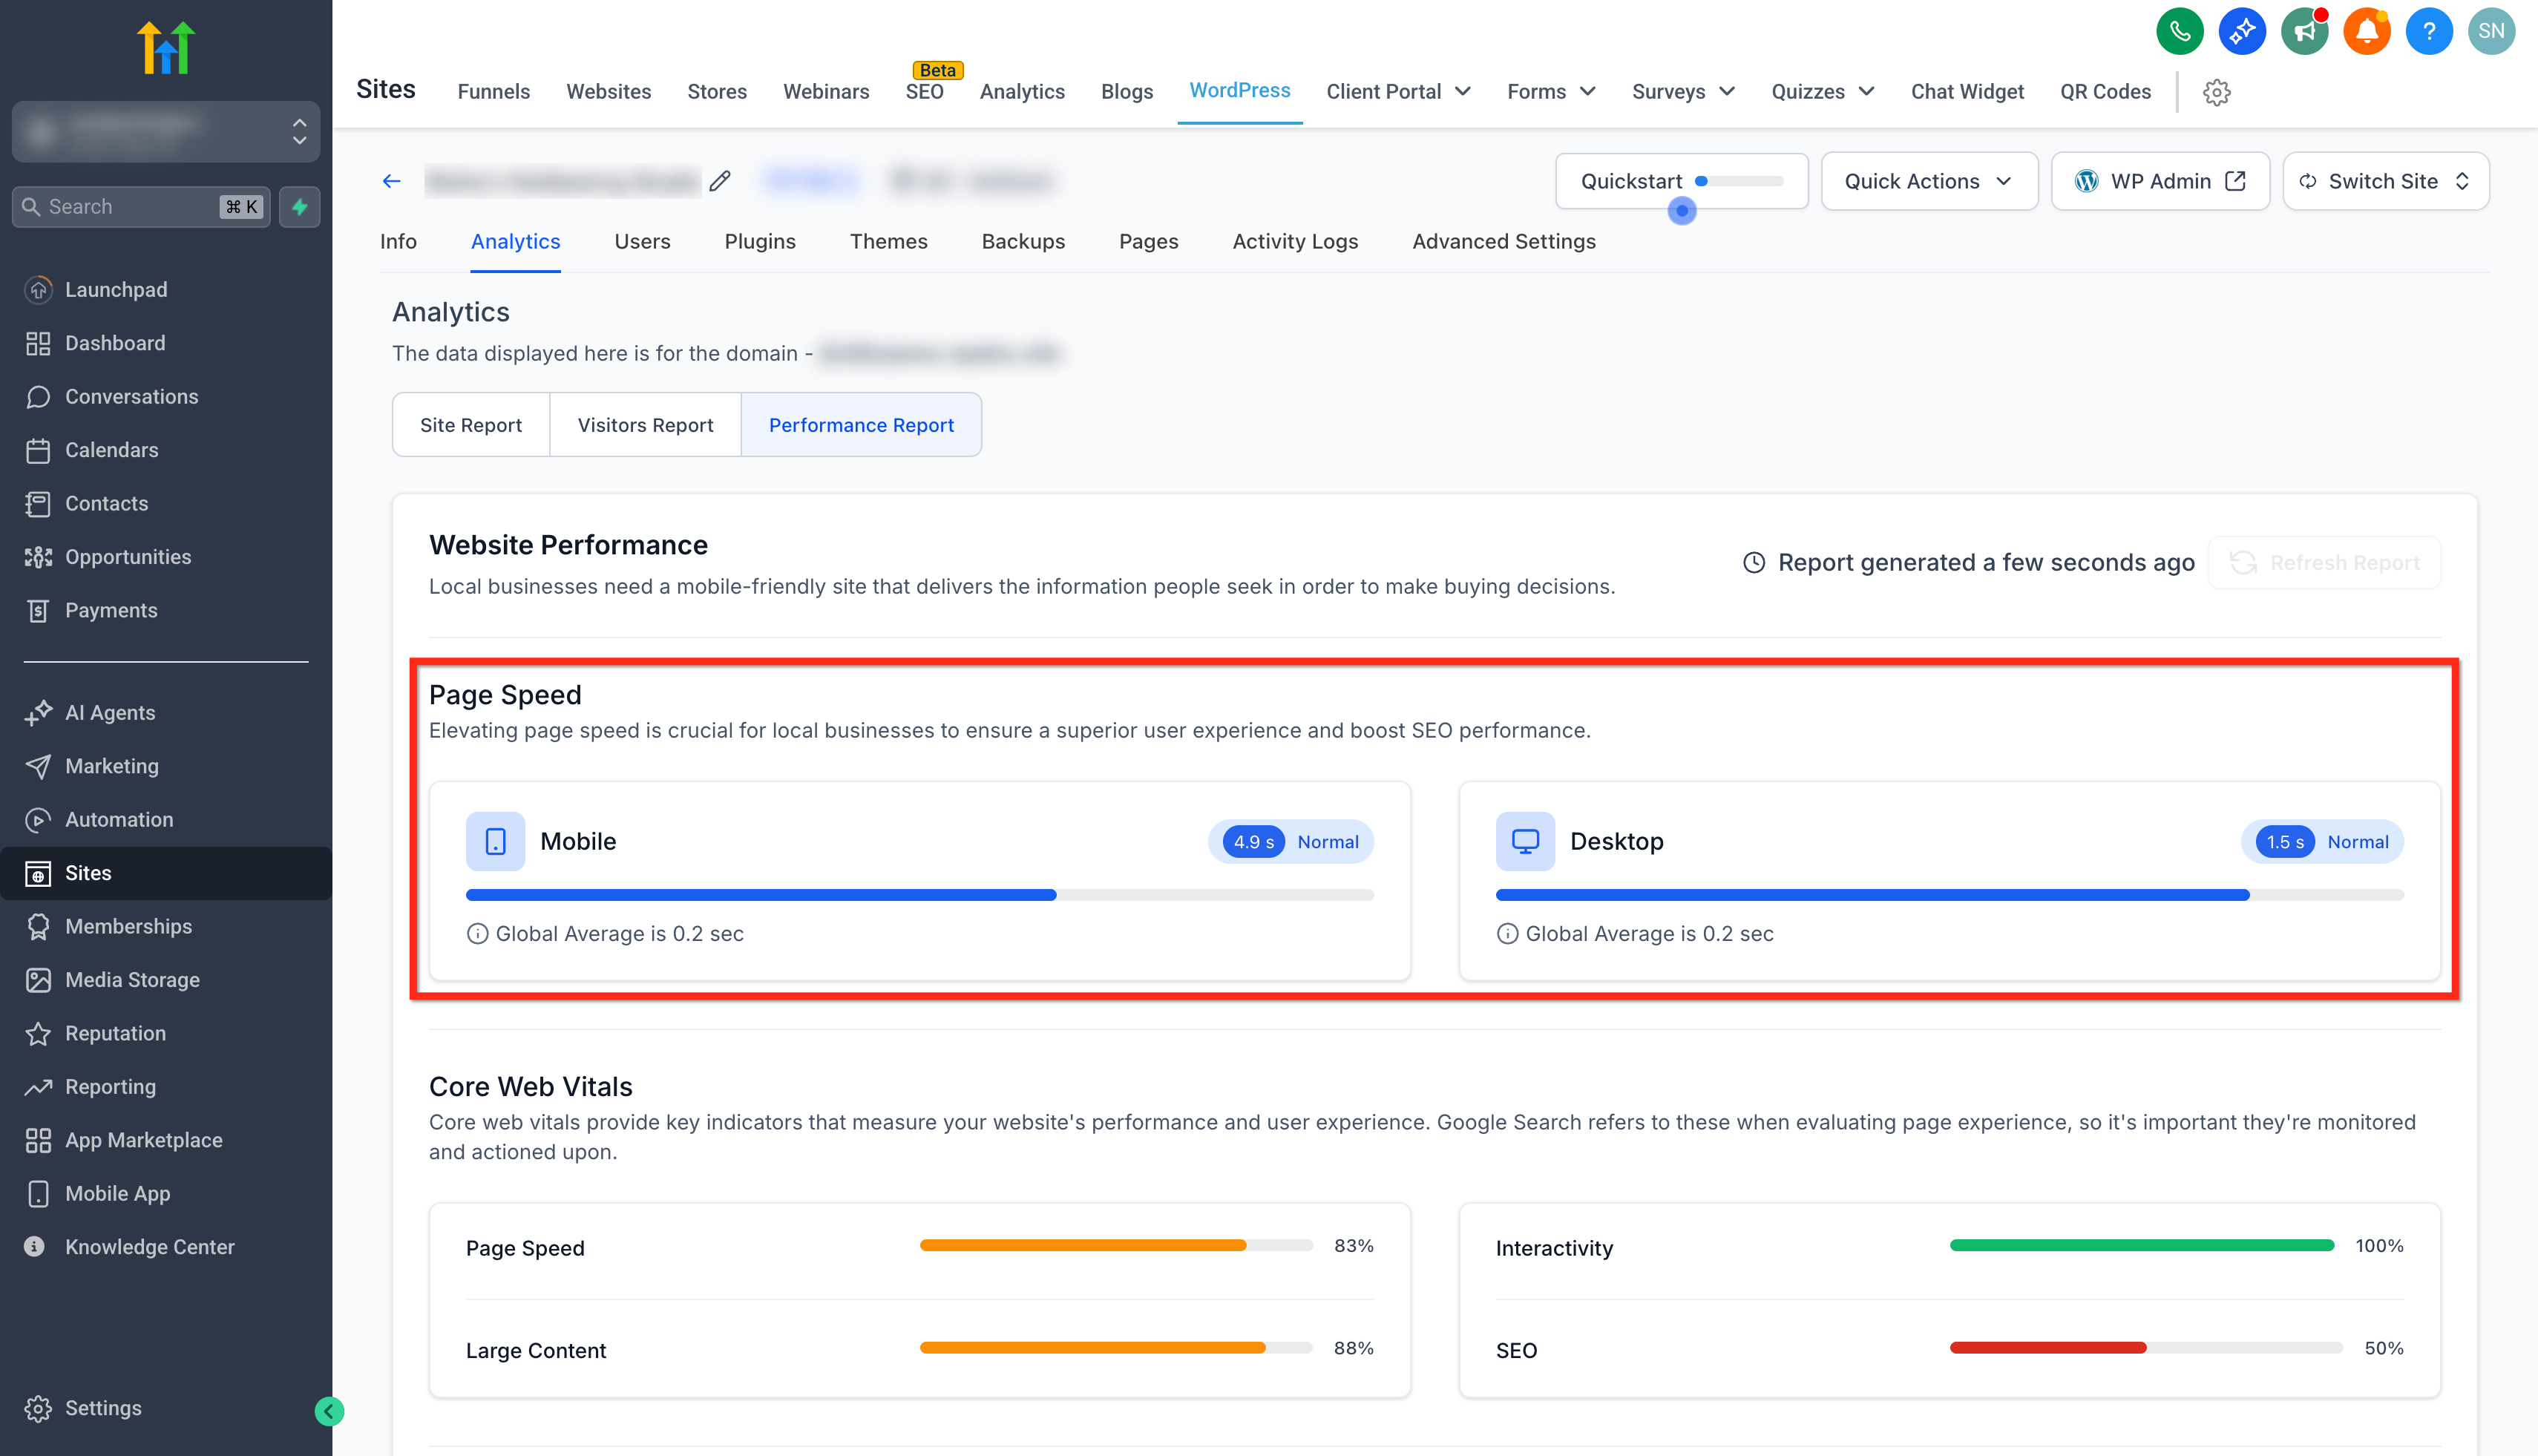
Step 4: Review Page Speed (Mobile & Desktop)
- Review the Page Speed scores for Mobile and Desktop.
- Note the load times for mobile and desktop, and compare them to the Global Averages displayed.
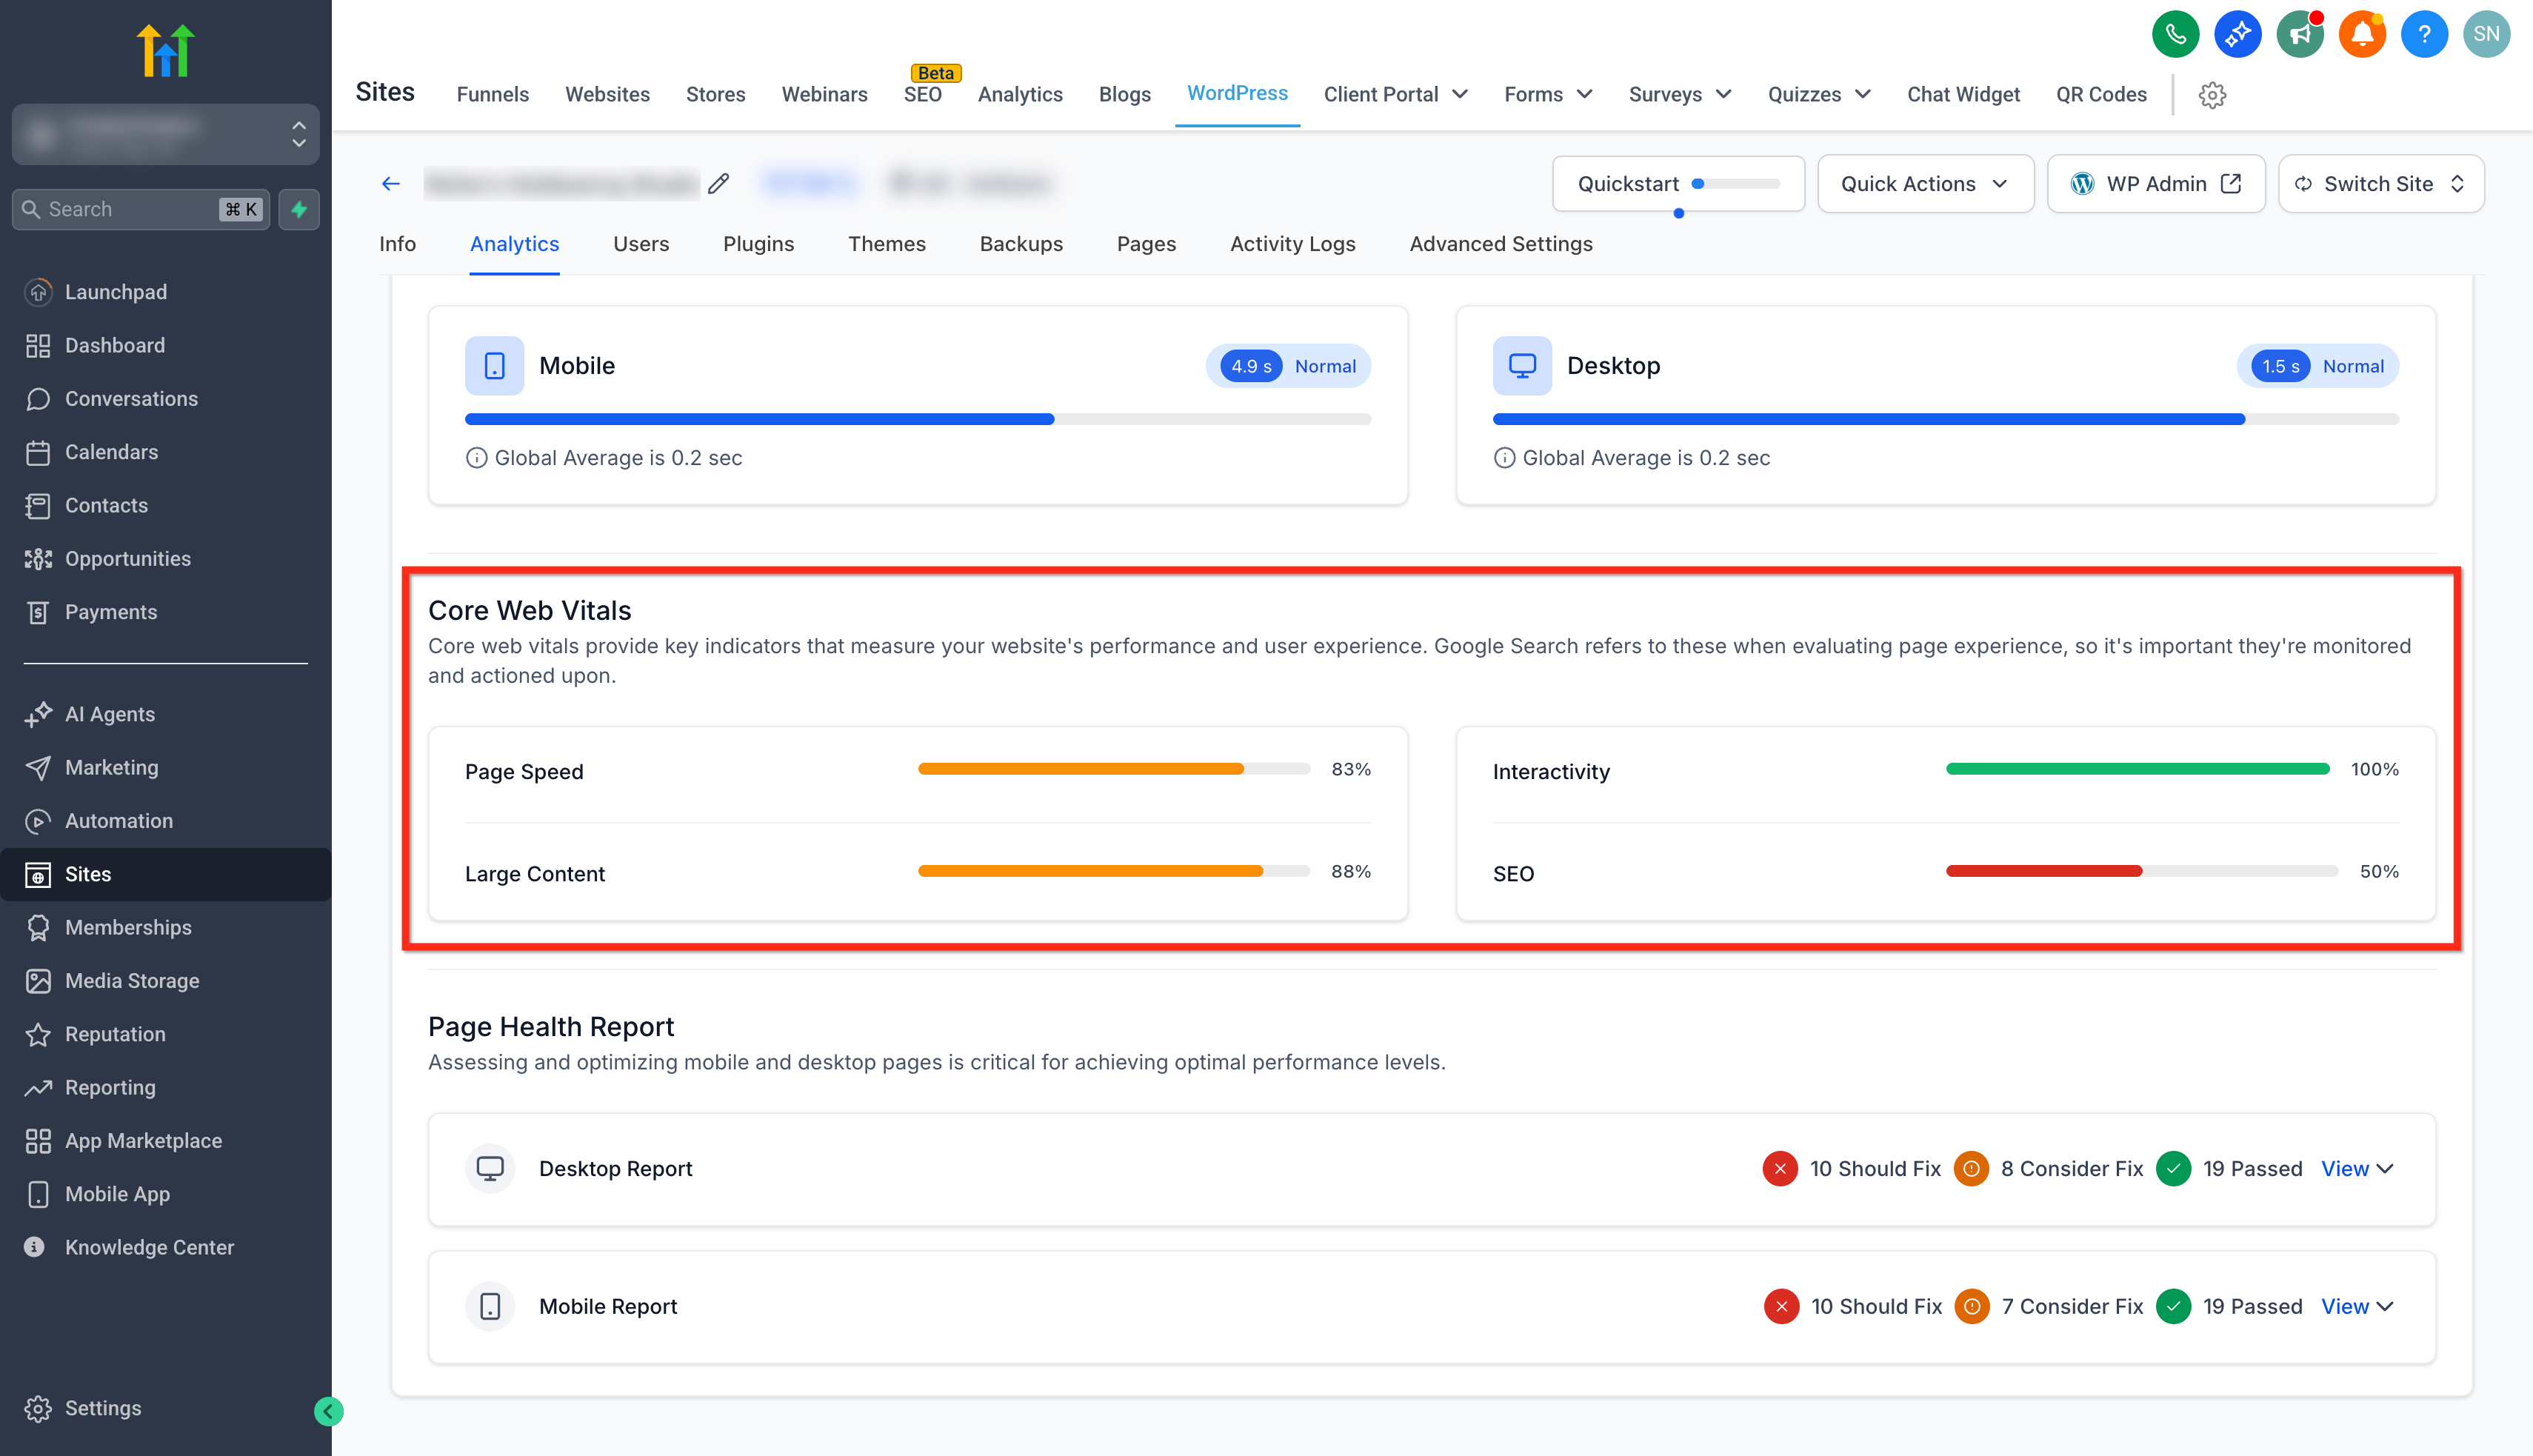
Step 5: Inspect Core Web Vitals
Why this matters: Google Search uses Core Web Vitals when evaluating page experience. Monitoring and acting on these metrics improves performance and discoverability.- Review the key indicators used by Google to evaluate page experience.
- Check each sub‑metric’s score. (e.g., Page Speed,Interactivity, Large Content, SEO)
- Prioritize items in red or flagged as poor.
Step 6: Audit Page Health Report (Desktop & Mobile)
- Switch between Desktop and Mobile reports to see device‑specific findings.
- Under each device, scan the groups: Should fix, Consider fix, and Passed.
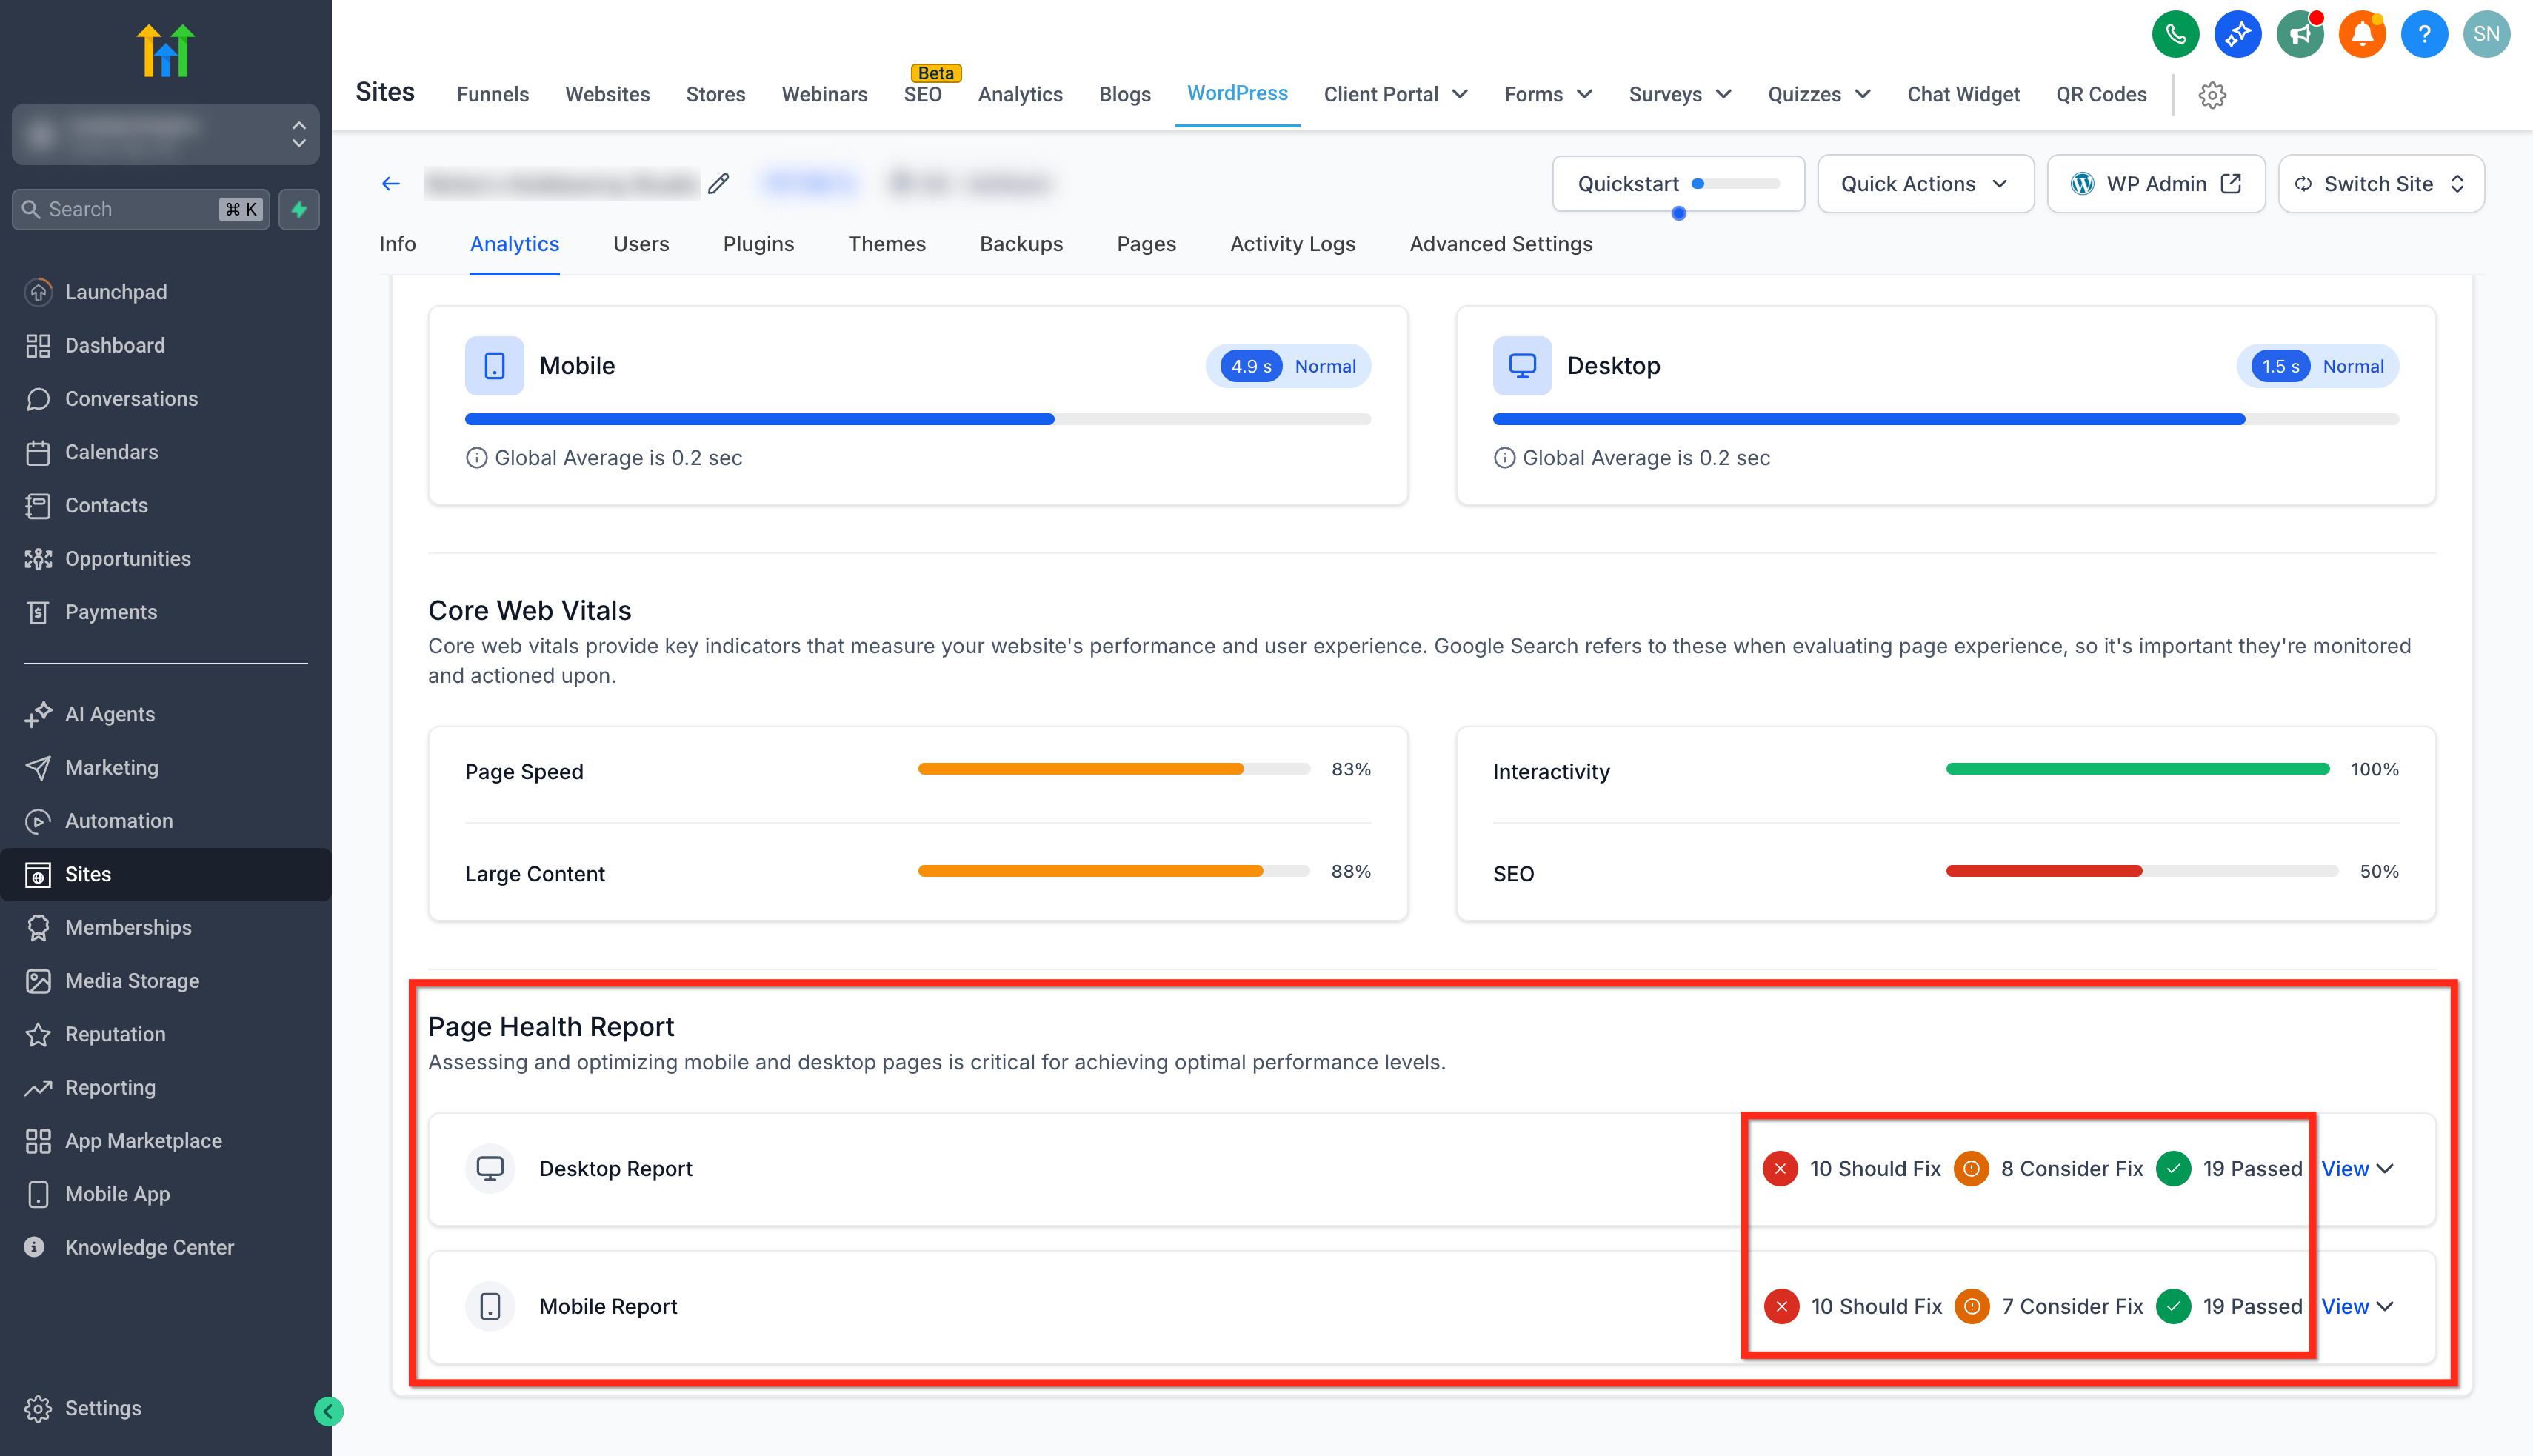
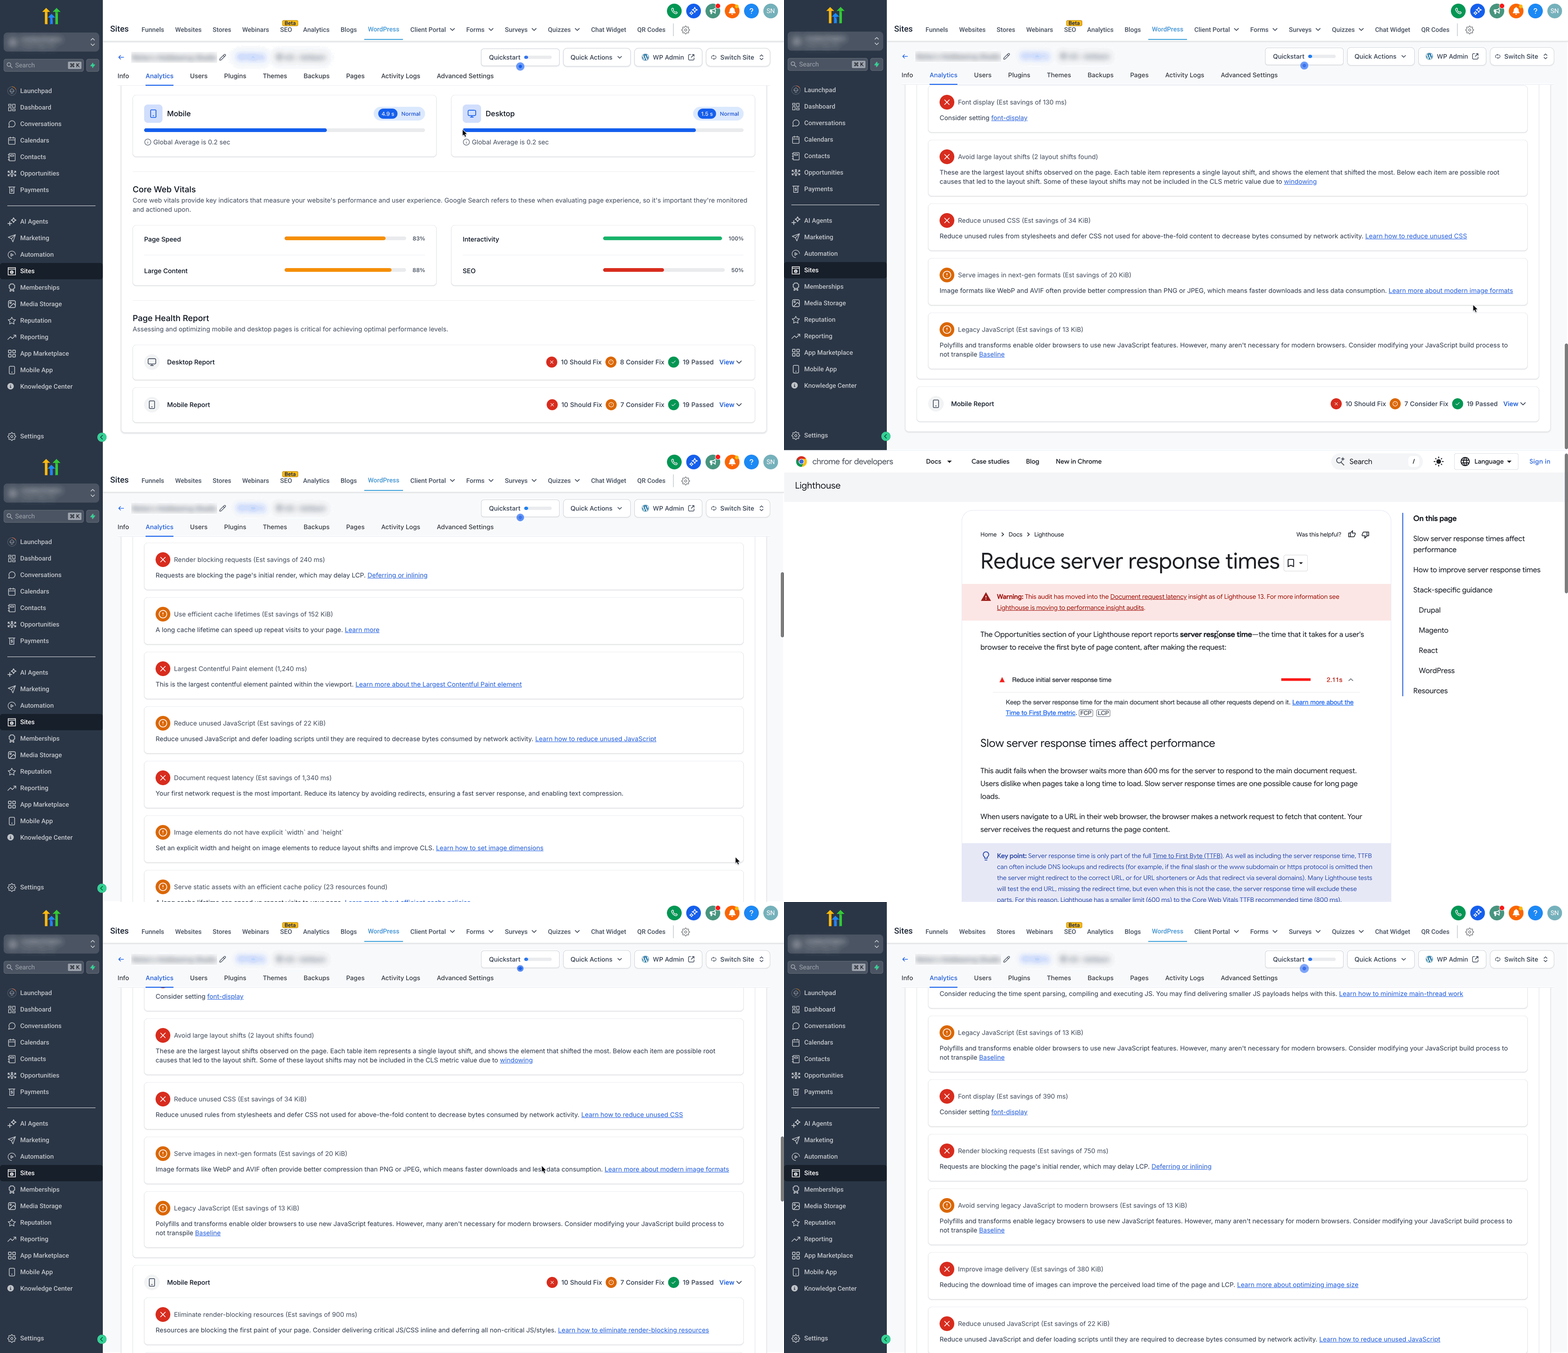
- For any issue, click View to expand and see actionable fixes.
- Each flagged item expands to explain the problem, why it matters, and how to resolve it—reducing guesswork for non-technical users and speeding up results for developers.
Frequently Asked Questions
Q: Does the Website Performance Report work for non‑SourCherry WordPress sites?
The report focuses on sites hosted on SourCherry WordPress Hosting. External or third‑party WordPress environments aren’t included.
Q: My lab score improved but Core Web Vitals didn’t—why?
Lab tests reflect changes immediately. Any field‑aggregated metrics can lag until enough real visitors experience the updated page.
Q: What should I check first if mobile scores are much lower than desktop?
Start with image dimensions/compression, critical CSS, and third‑party scripts. Also confirm your server region is close to your primary audience.
Q: Can plugins affect performance scoring?
Yes. Heavy or conflicting plugins can hurt LCP/INP. Audit installed plugins and review the Blocked Plugins list before adding performance tools.