
The WordPress Uptime Monitor in SourCherry gives users real‑time visibility into site availability, response time trends, and incident history, directly from the WordPress hosting dashboard. This guide explains what the feature does, how to enable it, and how to read the data for faster troubleshooting.
TABLE OF CONTENTS
- What is the WordPress Uptime Monitor?
- Key Benefits of the Uptime Monitor
- Status & Health Cards
- Response Time Analytics
- Recent Events (Incident Feed)
- How To Use the WordPress Uptime Monitor
- Frequently Asked Questions
- Related Articles
What is the WordPress Uptime Monitor?
The WordPress Uptime Monitor performs periodic checks on each hosted WordPress site to confirm availability and capture response time. It also records incidents (downtime and restoration) with timestamps and context so your team can quickly investigate, resolve, and report on reliability without leaving SourCherry.
Continuously checks site availability and performance for hosted WordPress sites.
Surfaces a modern dashboard with status/health cards, response time analytics, and a Recent Events feed.
Centralizes monitoring in the same place you manage hosting, backups, and WordPress tools.
Key Benefits of the Uptime Monitor
Faster Incident Response: Catch disruptions quickly using chronological event tracking and status indicators.
Client Transparency: Share uptime history and performance insights to build trust and document reliability.
Root‑cause Focus: Review event reasons (e.g., forbidden access, server restrictions) to prioritize fixes effectively.
Single Dashboard: Monitor uptime, performance, and recoveries in the same SourCherry hosting UI.
Performance Awareness: Compare minimum, average, and peak response times over recent periods for context.
Status & Health Cards
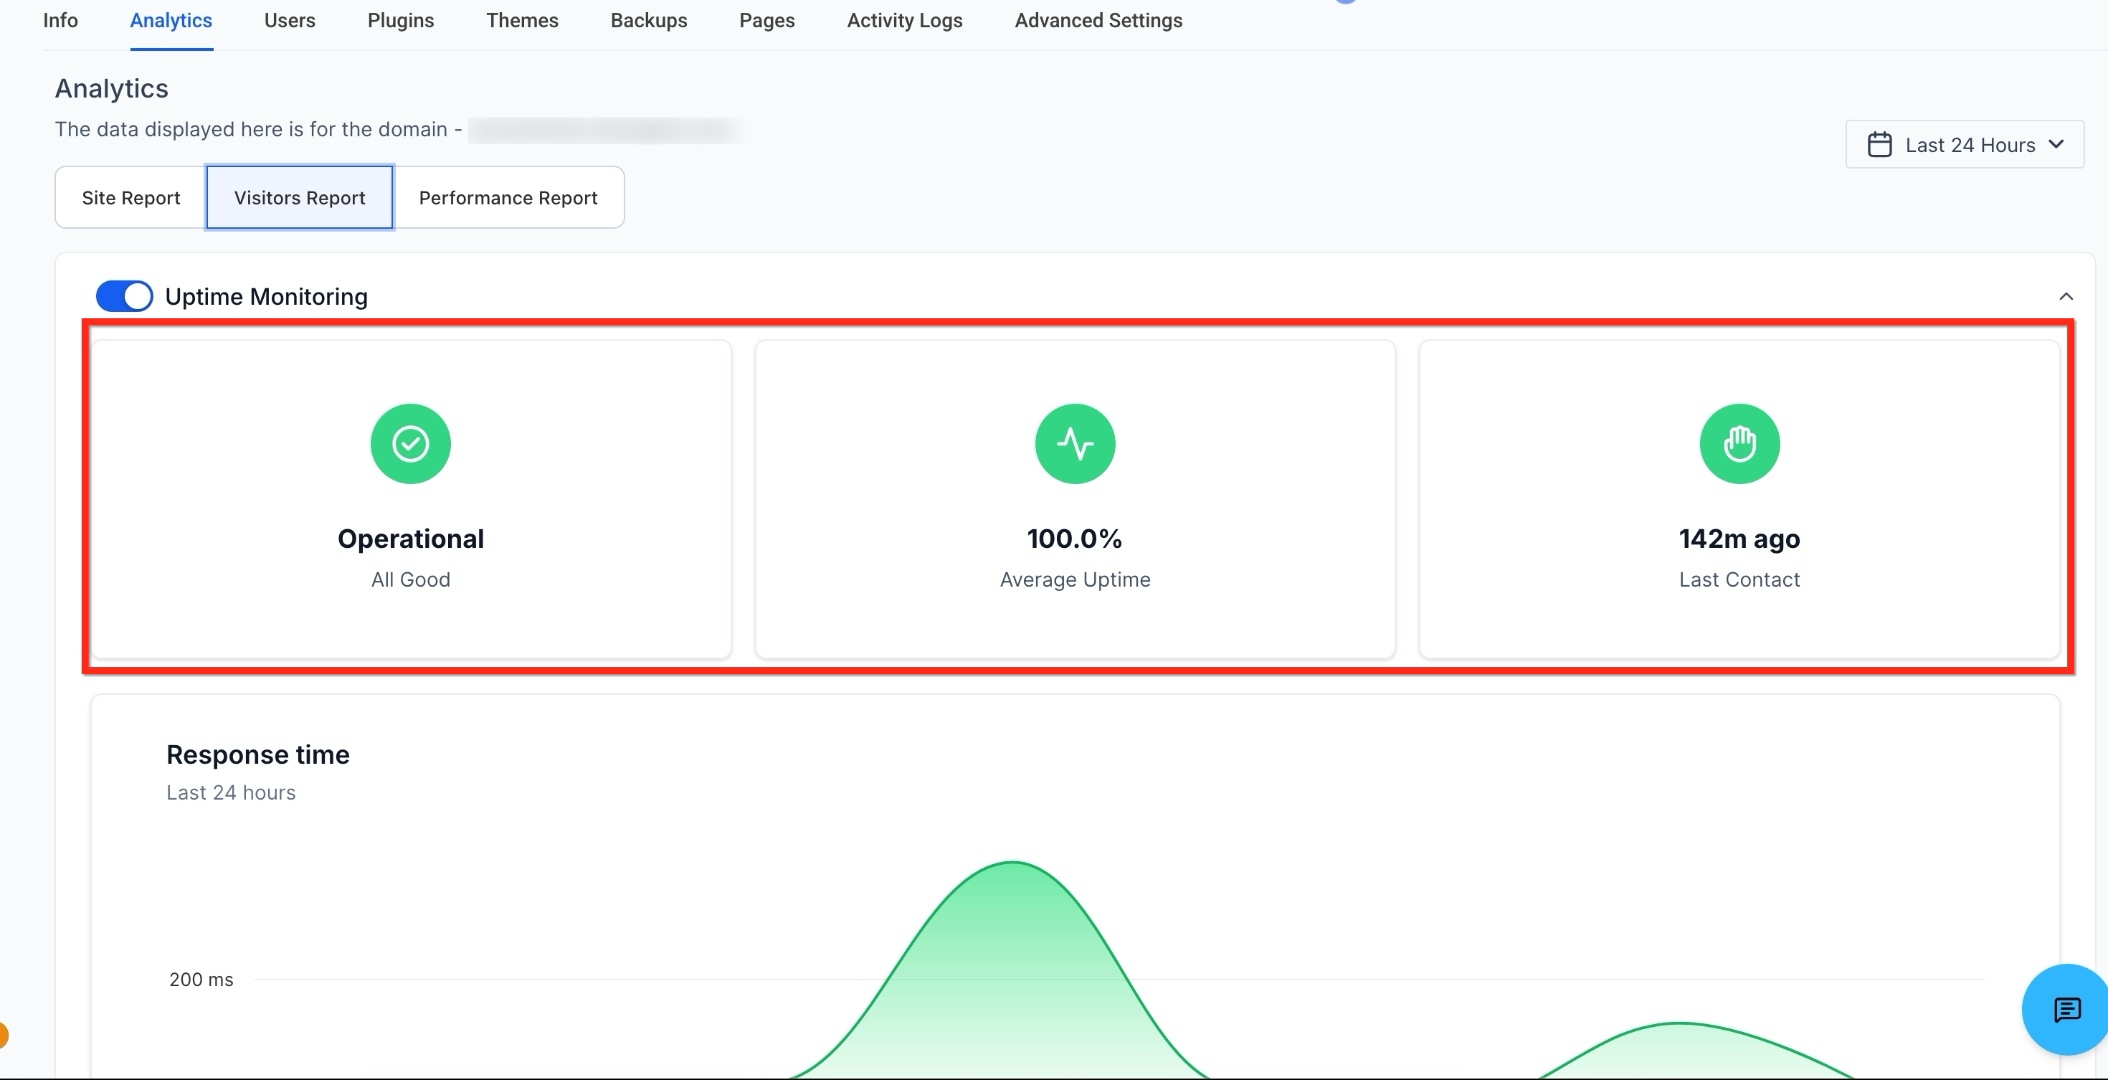
Status cards summarize the big picture—ideal for quick checks and daily standups—so you can decide whether deeper investigation is needed.
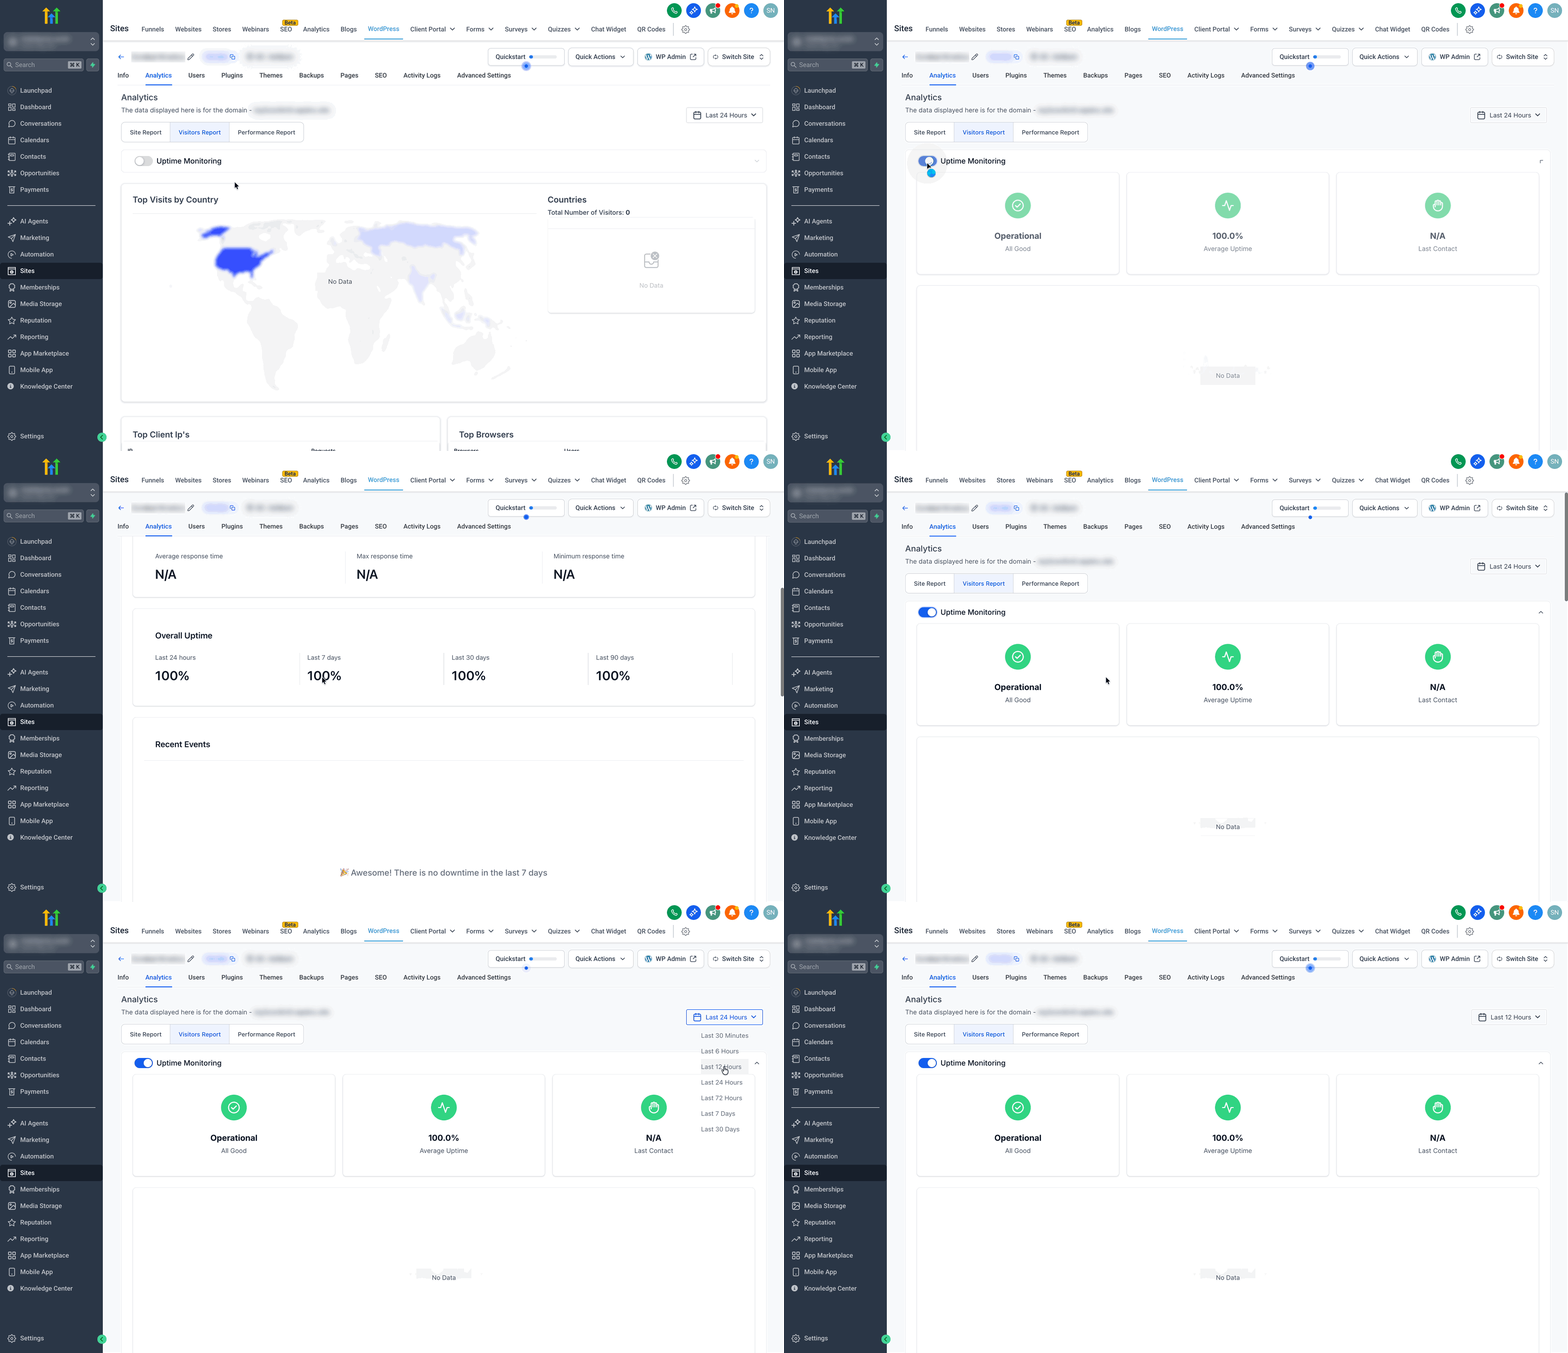
Operational Status: Indicates if the site is currently reachable.
Average Uptime: Summarizes availability over the selected range.
Last Health Check: Confirms the monitor is actively checking and when it last ran.
Response Time Analytics
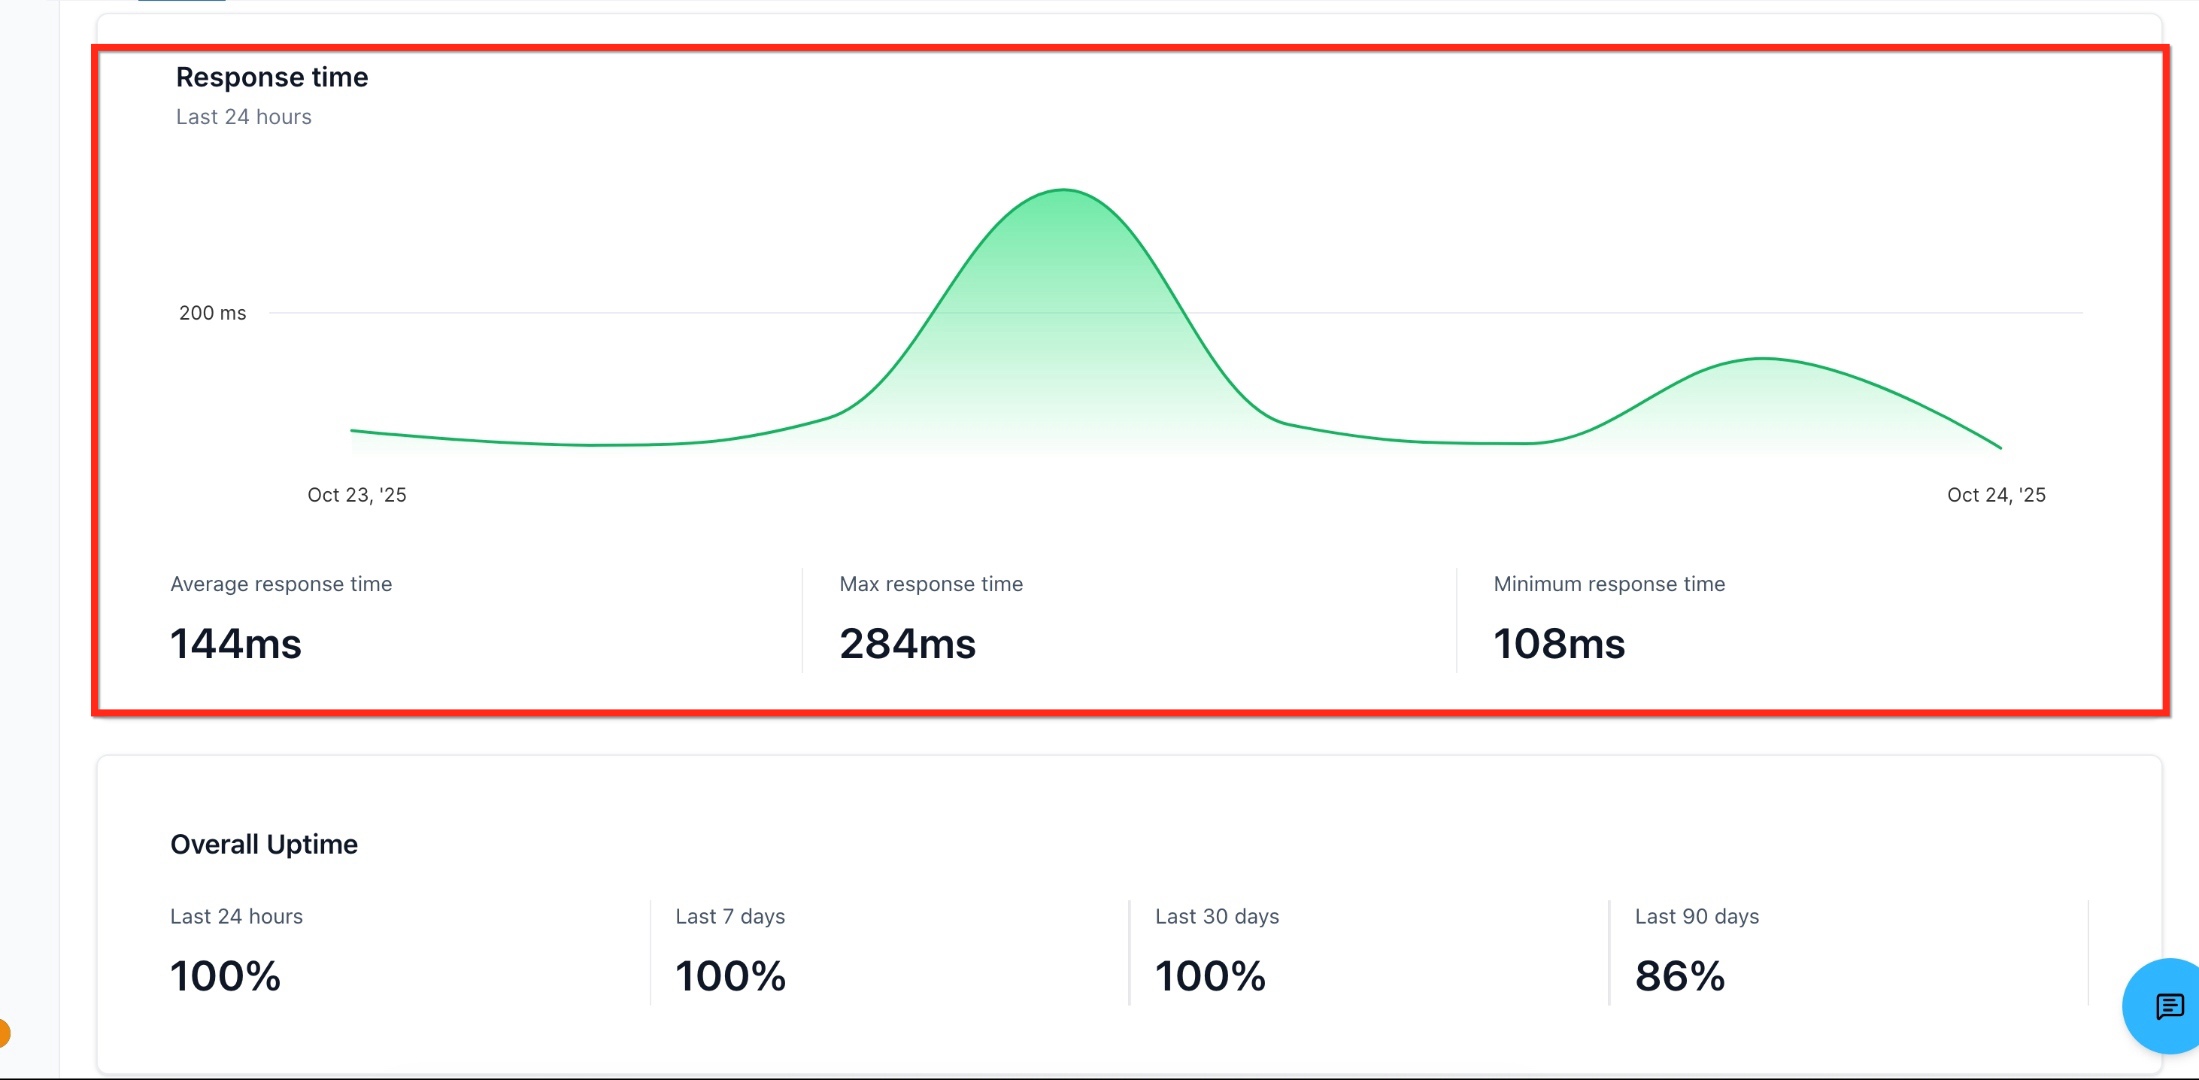
Response time trends reveal early signs of trouble—such as slow origins, regional latency, or resource bottlenecks—before full downtime occurs.
Track minimum, average, and maximum response times over the last 24 hours; switch to longer ranges if available to benchmark performance.
Use spikes to investigate: plugin updates, theme changes, traffic surges, or server resource constraints.
Pair with hosting region guidance to reduce network latency for your audience.
Recent Events
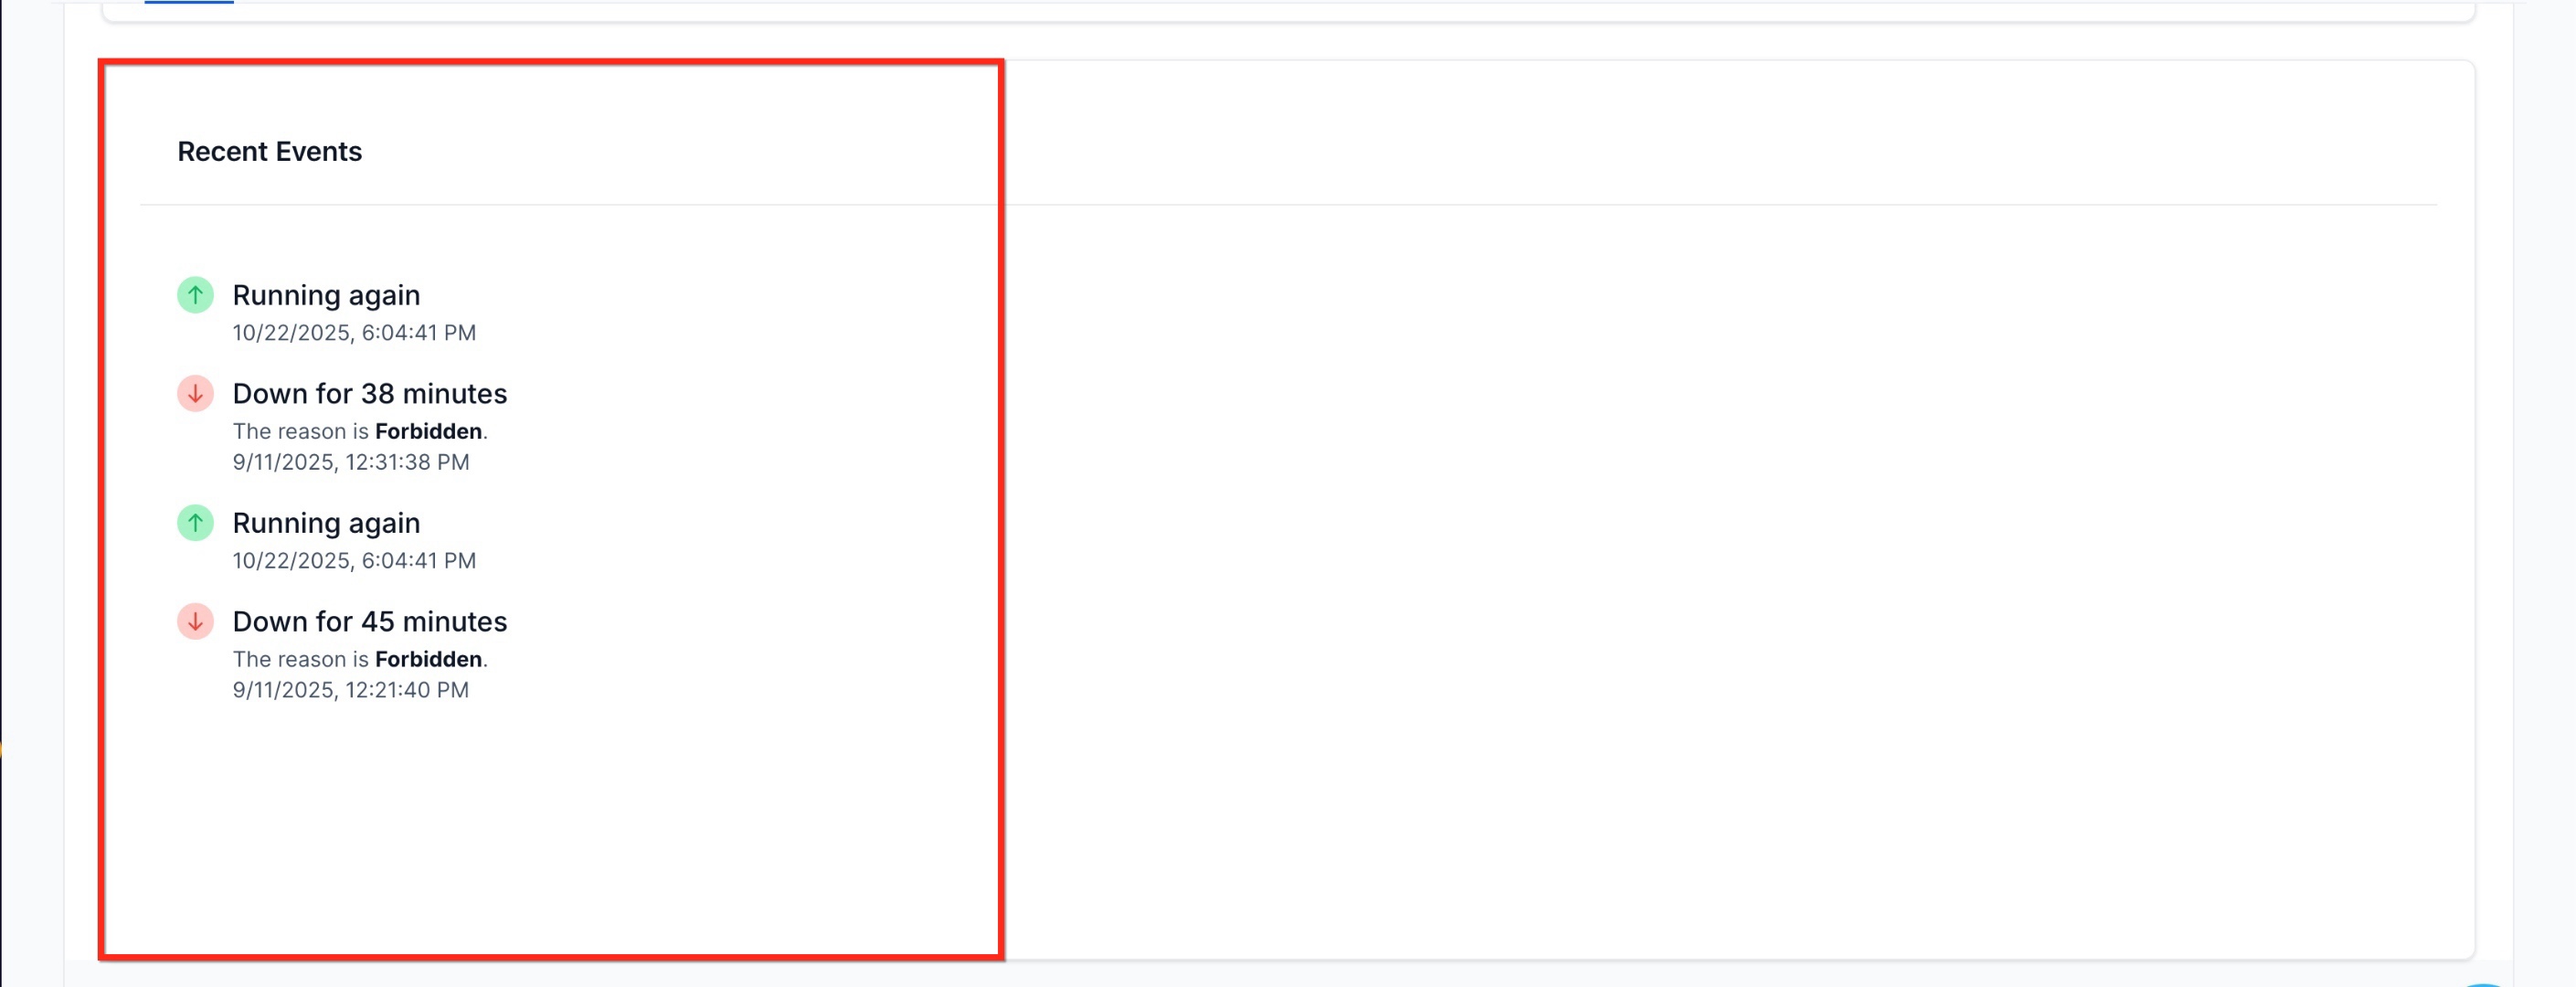
The events feed provides a chronological audit of downtime and recovery, including timestamps and contextual reasons so teams can triage faster.
View real‑time entries for downtime and automatic recovery, with recorded timestamps and causes (e.g., forbidden access or server restrictions).
Use events to validate when an issue started, when it recovered, and what likely triggered it.
Helpful during handoffs and client updates—copy the timestamps and notes into tickets and reports.
How To Use the WordPress Uptime Monitor
Use these simple steps to navigate and use the feature:
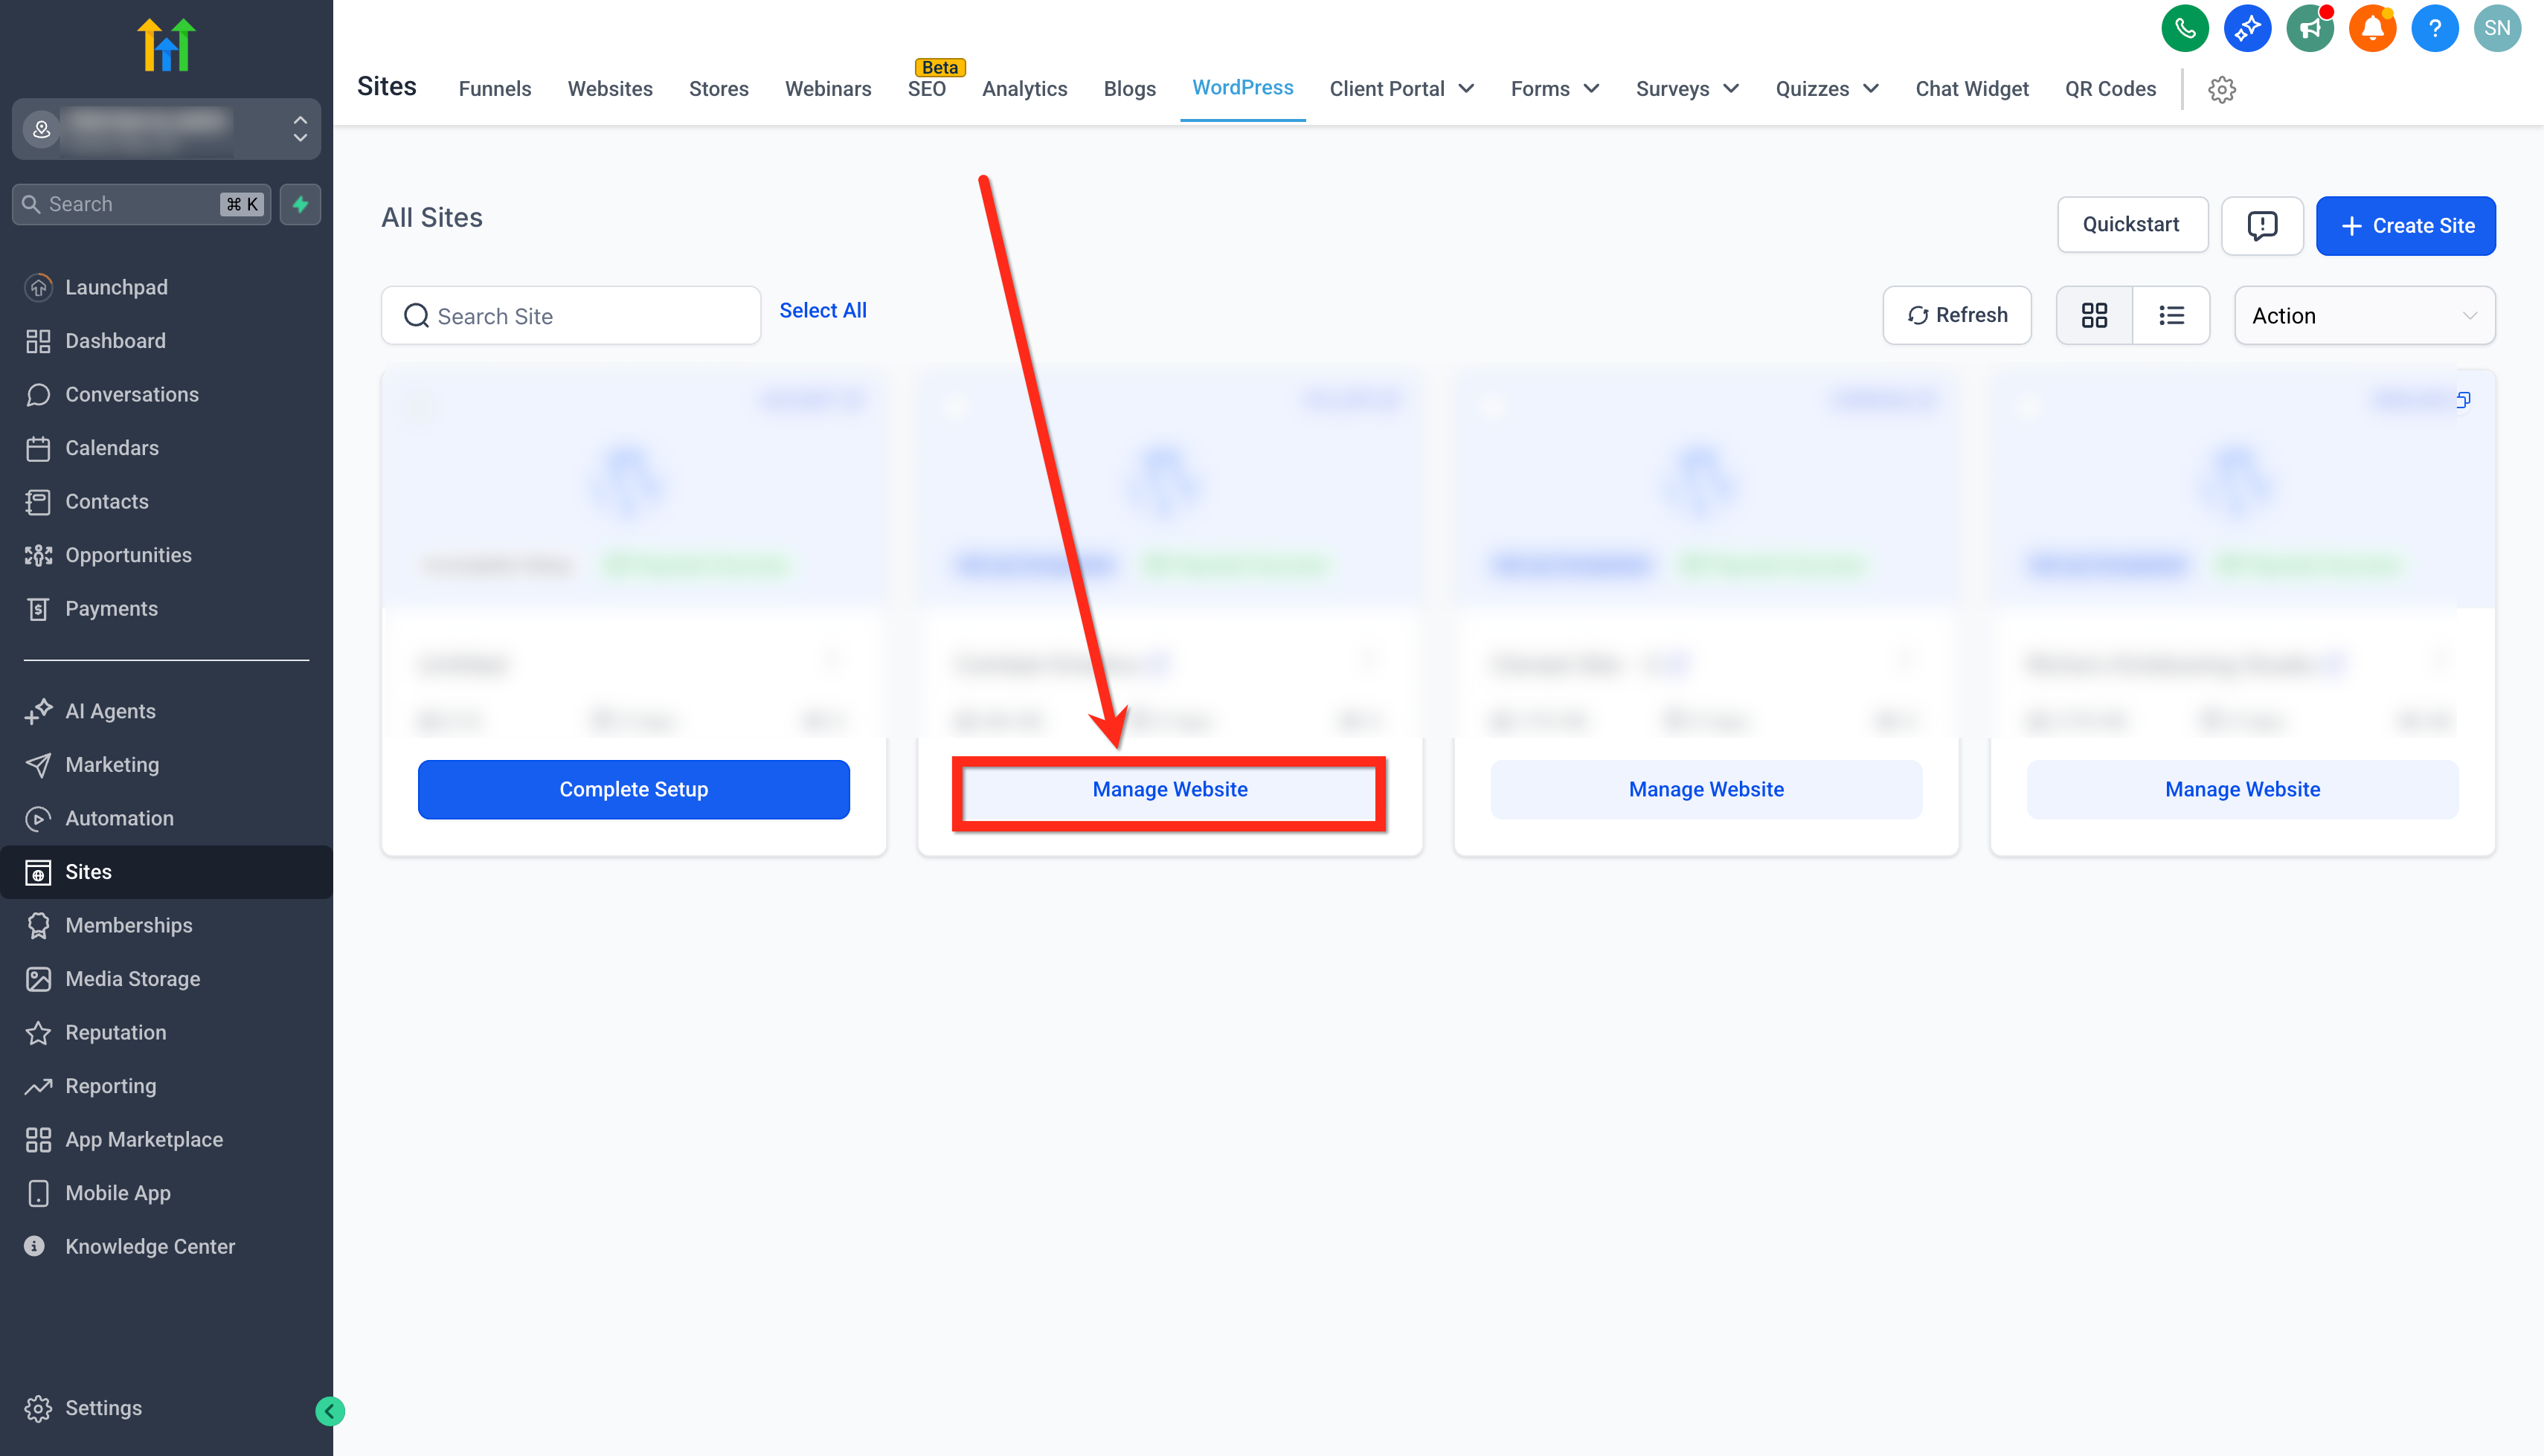
Go to Sites → WordPress.
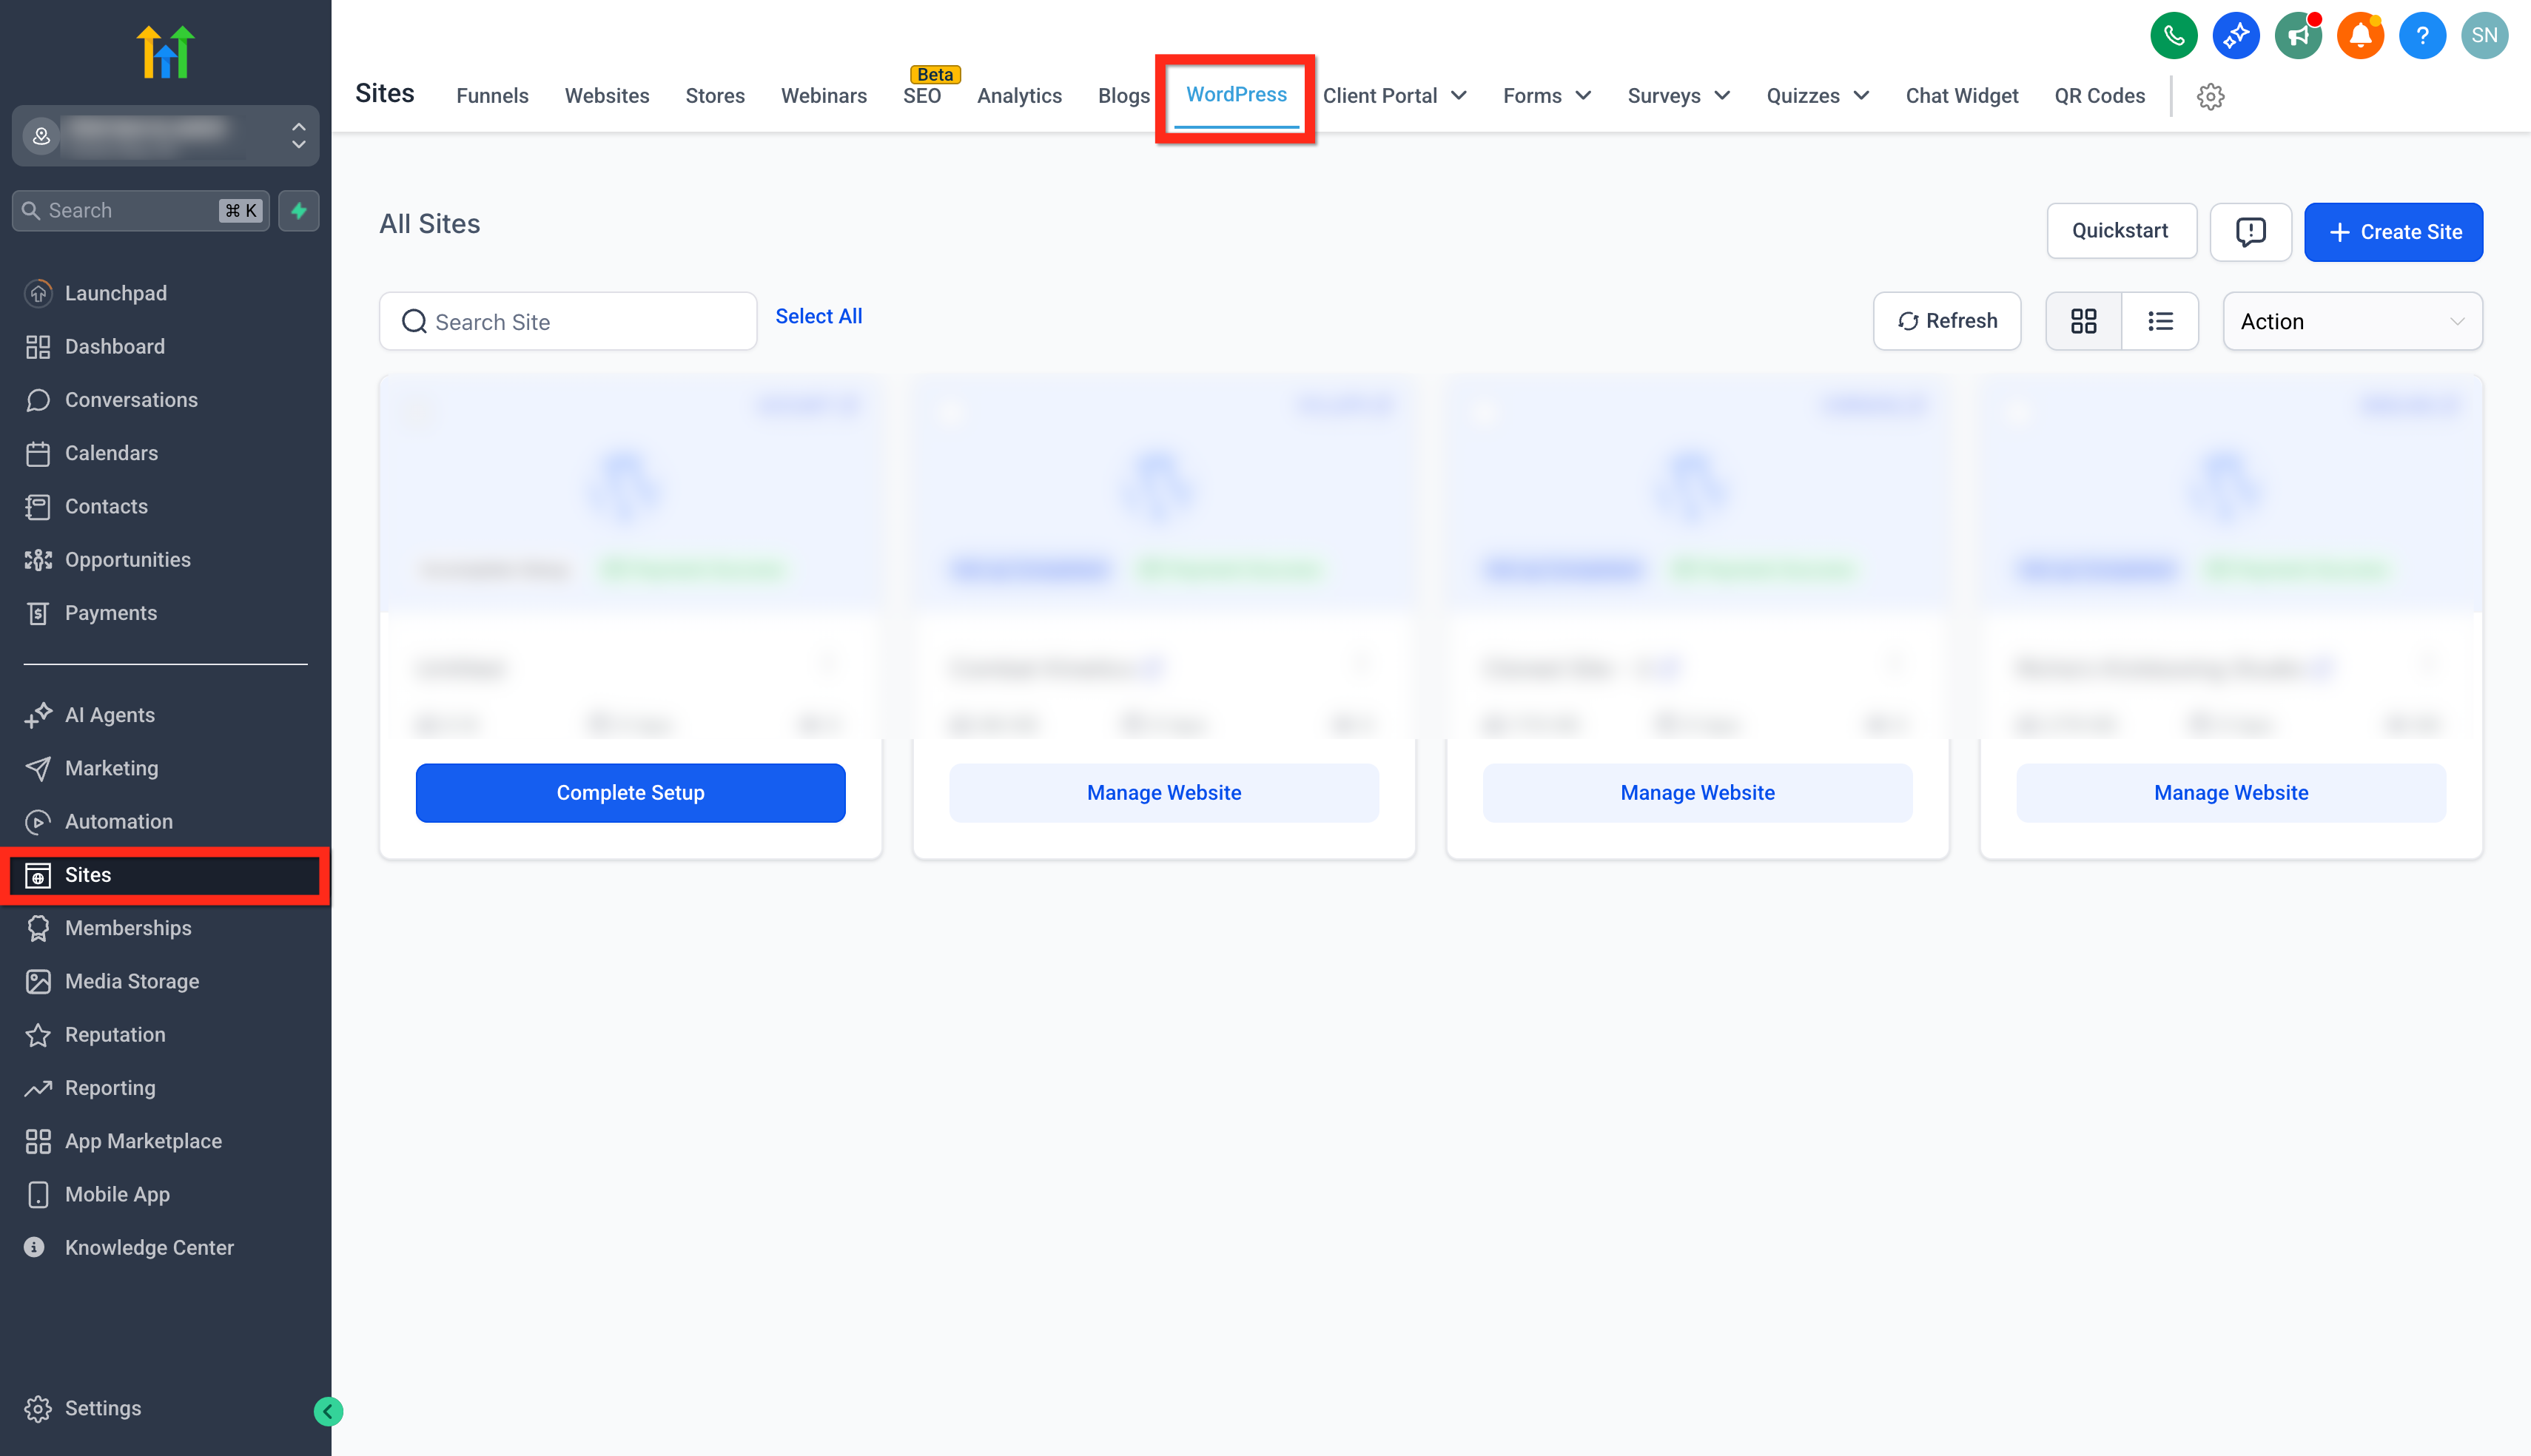
Click Manage Website for the site you want to monitor.
Open Analytics → Visitors Report.
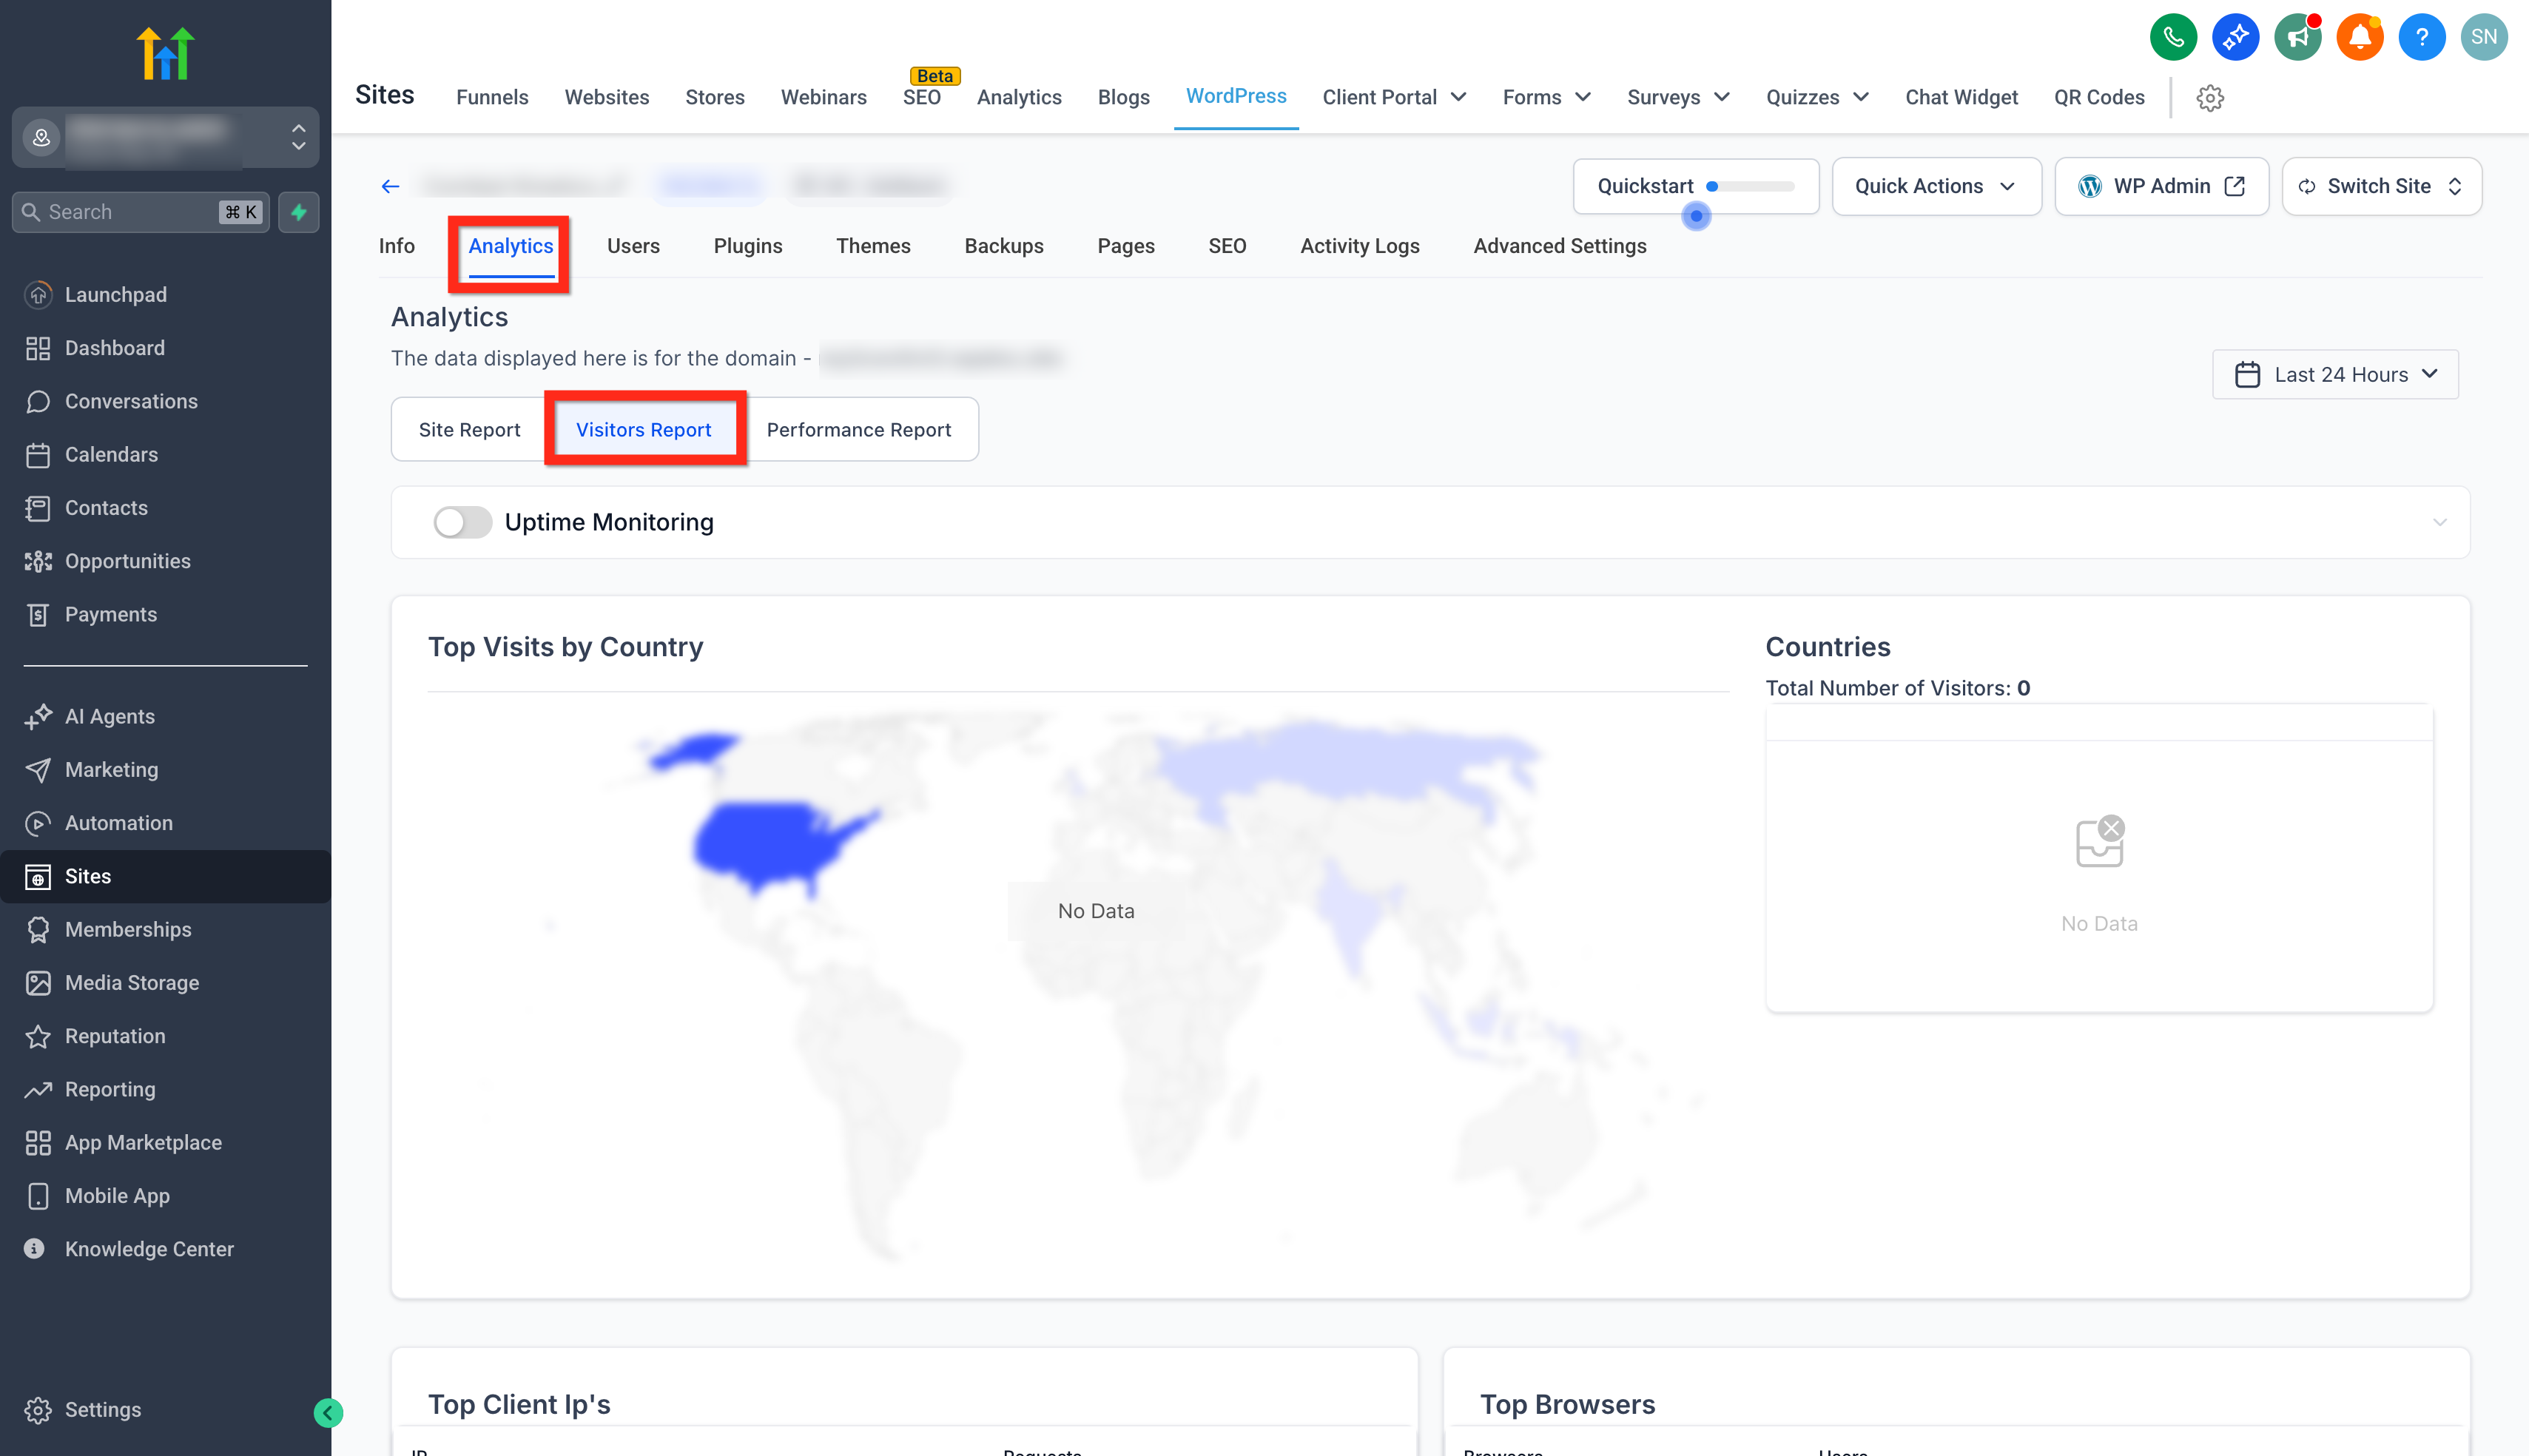
Locate the Uptime Monitor toggle and switch it On to start monitoring.
Frequently Asked Questions
Q: Does the Uptime Monitor send alerts (email/SMS/in‑app)?
No, the initial release focuses on in‑app visibility.
Q: Which URL is checked? Can I change it?
The monitor checks your site’s primary endpoint as configured in hosting.
Q: What time zone do timestamps use?
Timestamps follow your account/app context. Verify your sub‑account time zone before comparing with external tools.