
Bring your Google Analytics 4 (GA4) insights straight into SourCherry. With ready‑made widgets you can track users, engagement, traffic sources, and top pages without leaving the platform—ideal for agencies that want website analytics and CRM outcomes in one place. Build always‑on dashboards for daily monitoring and schedule client‑ready reports with zero spreadsheets.
TABLE OF CONTENTS
- What is Google Analytics Widgets?
- Key Benefits of Google Analytics Widgets
- Prerequisites & Access
- Available Google Analytics Widgets
- Dashboards vs Custom Reports
- Filtering & Customizing Widgets
- How To Setup Google Analytics Widgets
- Frequently Asked Questions
- Related Articles
What is Google Analytics Widgets?
Google Analytics Widgets are pre‑built visual blocks that surface GA4 metrics inside a SourCherry sub‑account. After connecting a GA4 property, you can place widgets—such as Total Users, Engagement Rate, or Sessions by Channel—on dashboards and custom reports to evaluate website behavior alongside pipeline, attribution, and revenue data. This centralizes insights for faster, data‑driven decisions.
Key Benefits of Google Analytics Widgets
Understanding the value of each widget helps you assemble dashboards that answer real business questions. Use the benefits below to align GA data with goals like acquisition efficiency, content performance, and conversion health.
Single source of truth: Marry GA4 web analytics with CRM, ad, and sales metrics in one workspace.
Faster decisions: Spot traffic spikes, engagement dips, or top‑performing pages at a glance.
Audience insights: Compare new vs. returning users, devices, and channels to optimize campaigns.
Time savings: Skip CSV exports and tab‑switching; dashboards and reports pull data automatically.
Client transparency: Share live web reports with stakeholders without granting GA access.
Prerequisites & Access
Confirm access and connections before adding widgets to ensure data loads correctly the first time.
A connected GA4 property and data stream in Settings → Integrations → Google Analytics.
User permissions: ability to Edit dashboards to add widgets (or View to consume), and access to Create/Schedulereports where applicable.
Recommended: verify you have the right Google account and GA4 property permissions (view access to the property and stream).
Available Google Analytics Widgets
These widgets focus on the most useful GA4 KPIs for acquisition, engagement, and content analysis. Mix trend, breakdown, and leaderboard styles to create an at‑a‑glance story.
| Metric | Definition |
|---|---|
| Total Users | Total number of unique users who visited your website during the selected time period. |
| Active Users | Number of users who had an engaged session or were active on your site. |
| New Users | First‑time visitors to your website in the selected period. |
| Sessions Over Time | A time‑series view of total sessions across the selected date range. |
| Engagement Rate | Percentage of engaged sessions, indicating how actively users interact with content. |
| Bounce Rate | Percentage of sessions with no further engagement after a single page view. |
| Average Engagement Time | Average time users actively spend engaging with your website content. |
| Sessions by Channel | Sessions grouped by default acquisition channels (e.g., Organic Search, Paid Social). |
| Sessions by Source/Medium | Sessions grouped by traffic source and medium pairs (e.g., google/organic, facebook/social). |
| Top Pages by Views | Most‑viewed pages ranked by total views. |
| Top Events | Most frequently triggered GA4 events (key interactions and behaviors). |
| New vs. Returning Users | Comparison of first‑time vs. returning visitors in the selected period. |
| Device Category Breakdown | Sessions by device type (desktop, mobile, tablet). |
Dashboards vs Custom Reports
Use dashboards for continuous monitoring and use custom reports to package insights for routine sharing. Both surfaces use the same GA widget library, so you can start with one and reuse layouts in the other.
Dashboards: Always‑on visual snapshot for daily checks and quick comparisons.
Custom Reports: Designed for scheduled email delivery and polished hand‑offs to clients or leaders.
Filtering & Customizing Widgets
Tailor each widget so stakeholders see only what matters. Filters, chart types, and layout controls turn raw data into focused, scannable visuals.
Date range controls: Use the dashboard/report picker to set the time window for all widgets on the page.
Chart types: Choose from Numeric, Donut, Line, Bar, or Table where available for the selected widget.
Filters & conditions: Narrow results (e.g., Source/Medium = google / organic, include/exclude channels, pages, or events).
Layout controls: Drag to reposition, resize for readability, duplicate widgets you want to compare with different filters, or remove unneeded ones.
Theming: Optional theme choices let you present data consistently across dashboards and reports.
How To Setup Google Analytics Widgets
A short one‑time connection enables you to add GA4 widgets to dashboards and reports. Follow the step‑by‑step process below to visualize performance and share it with stakeholders.
Add Widgets to a Dashboard
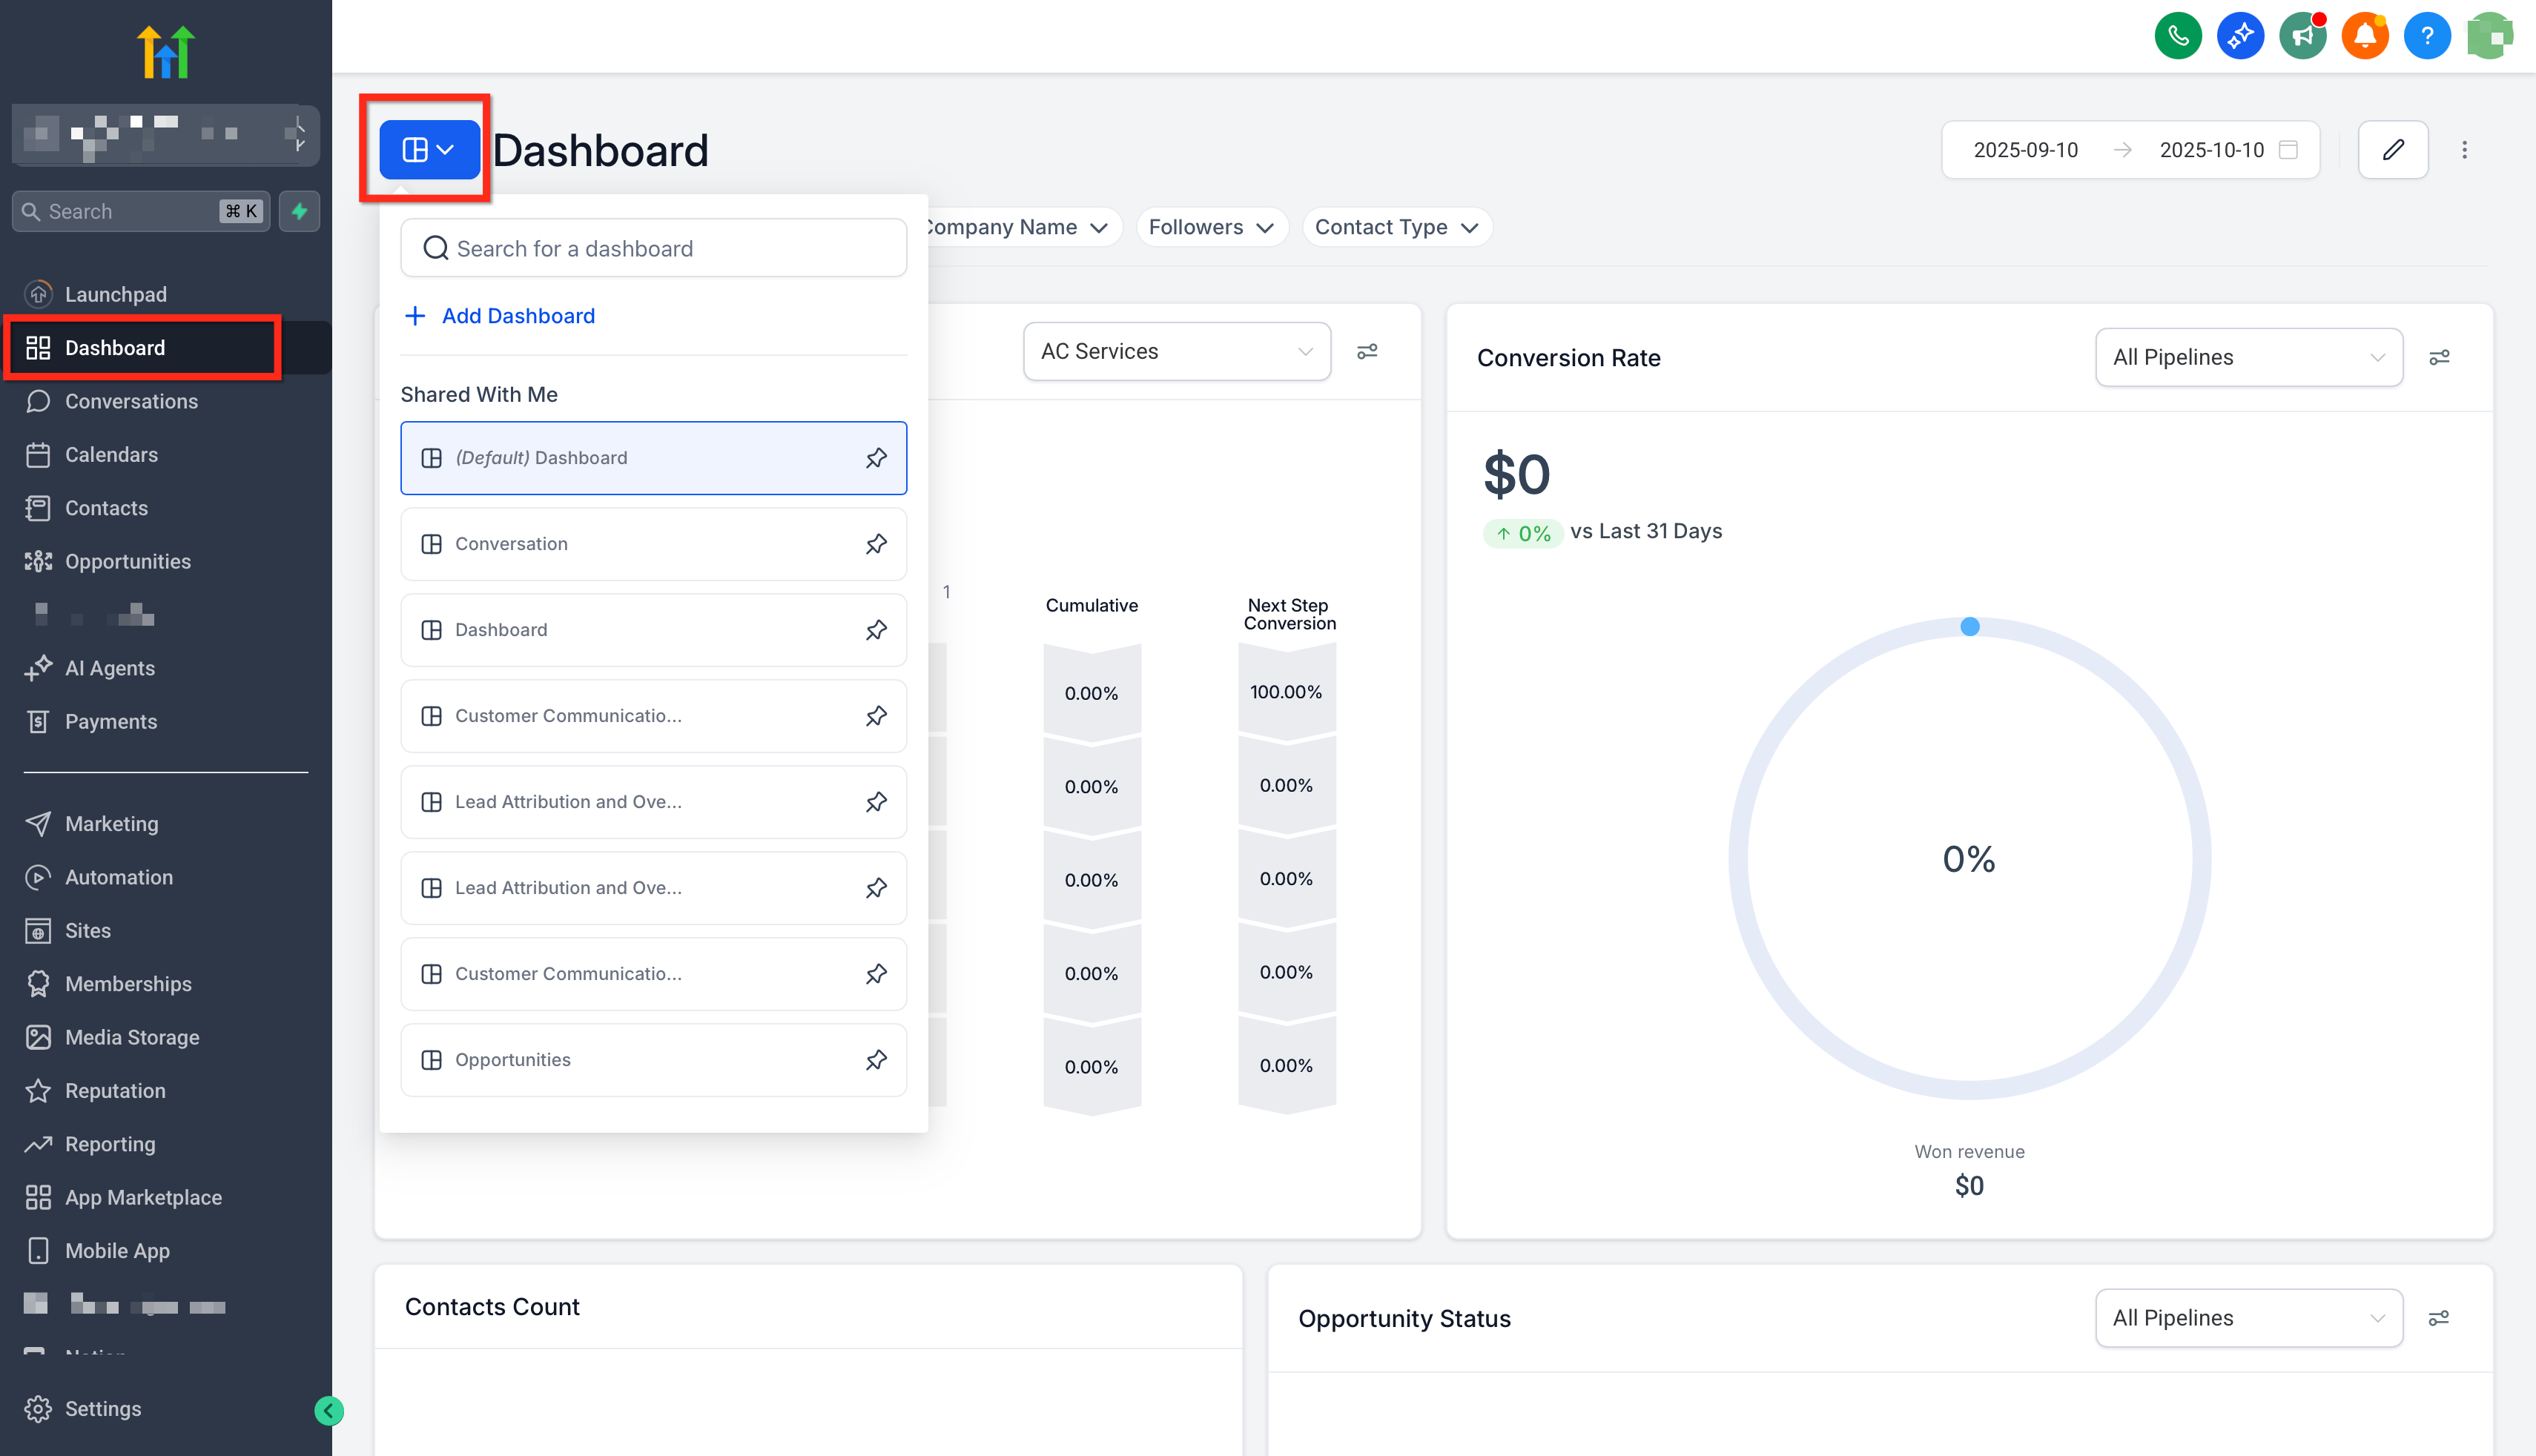
In your Sub‑Account, open Dashboard and click the blue button in the top‑left to open the desired dashboard.
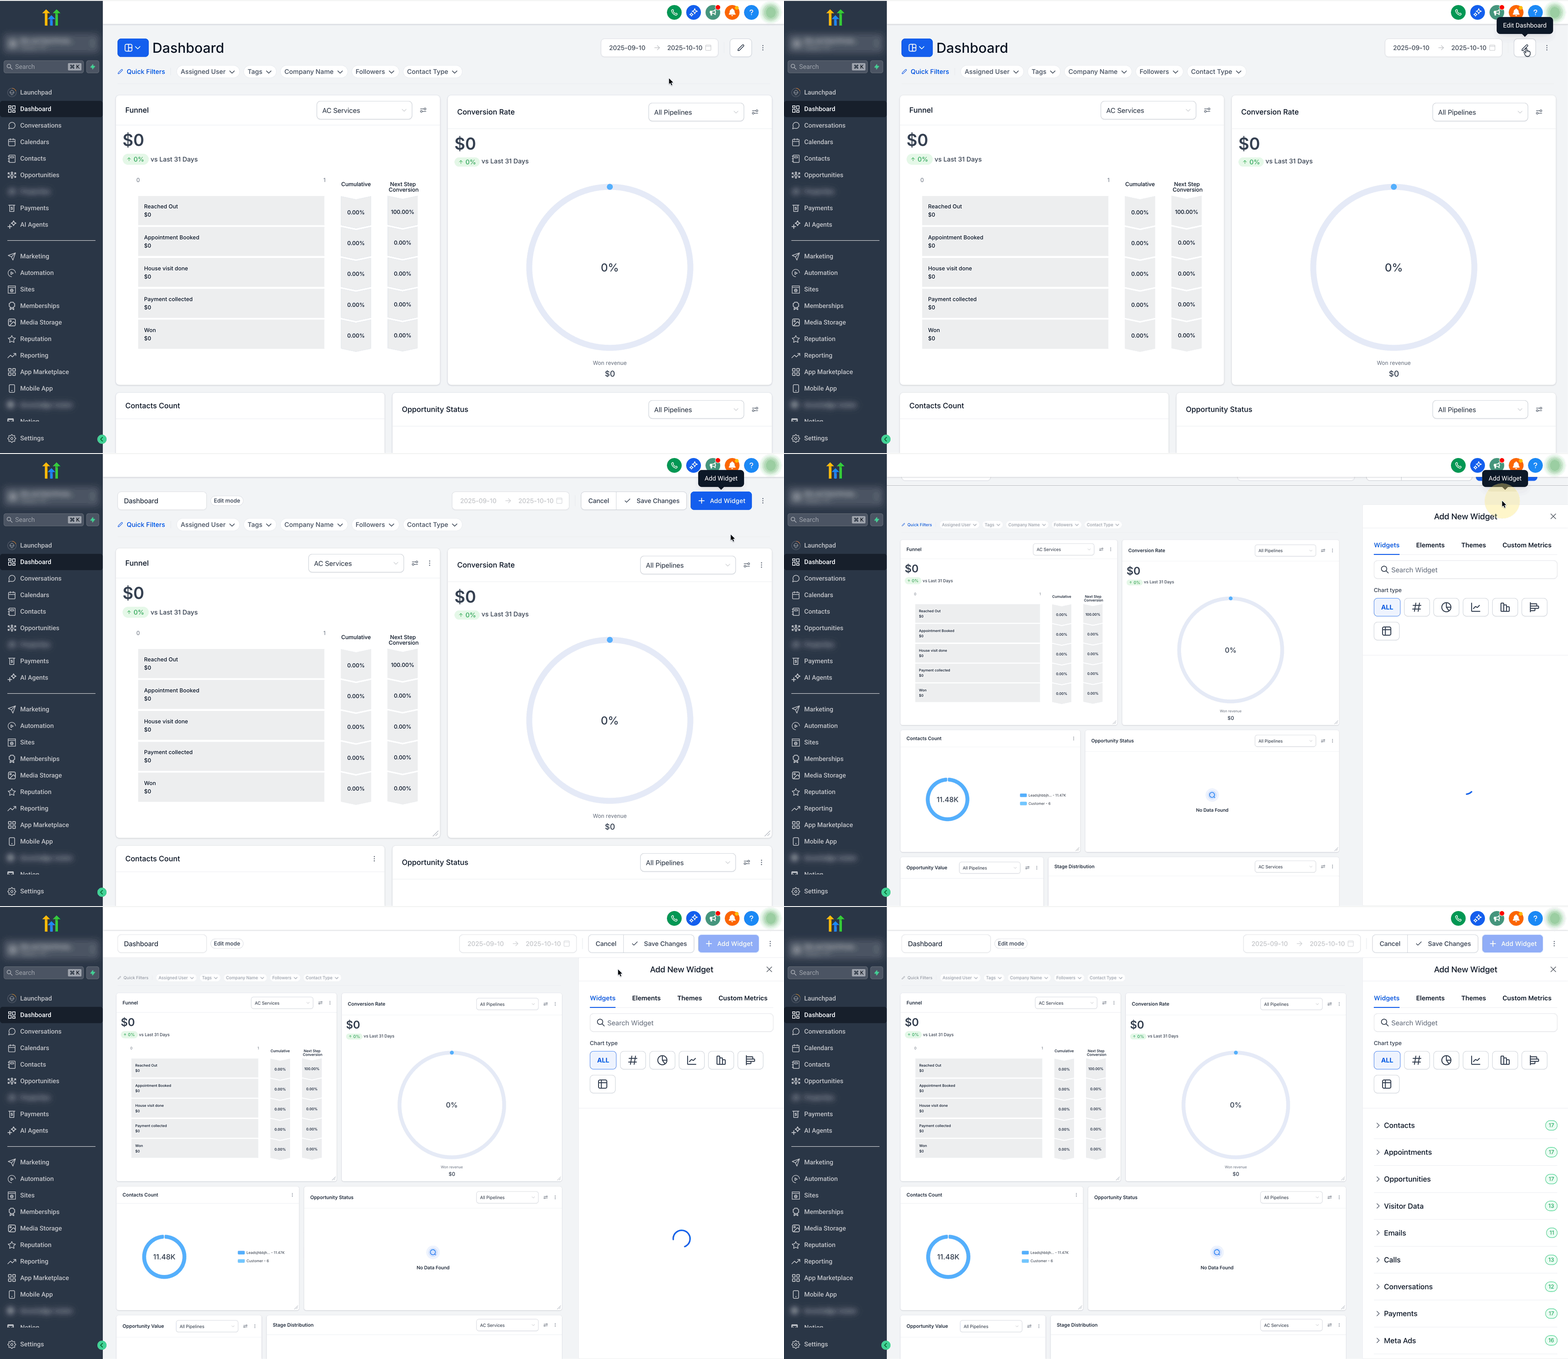
Click Edit Dashboard → Add Widget.
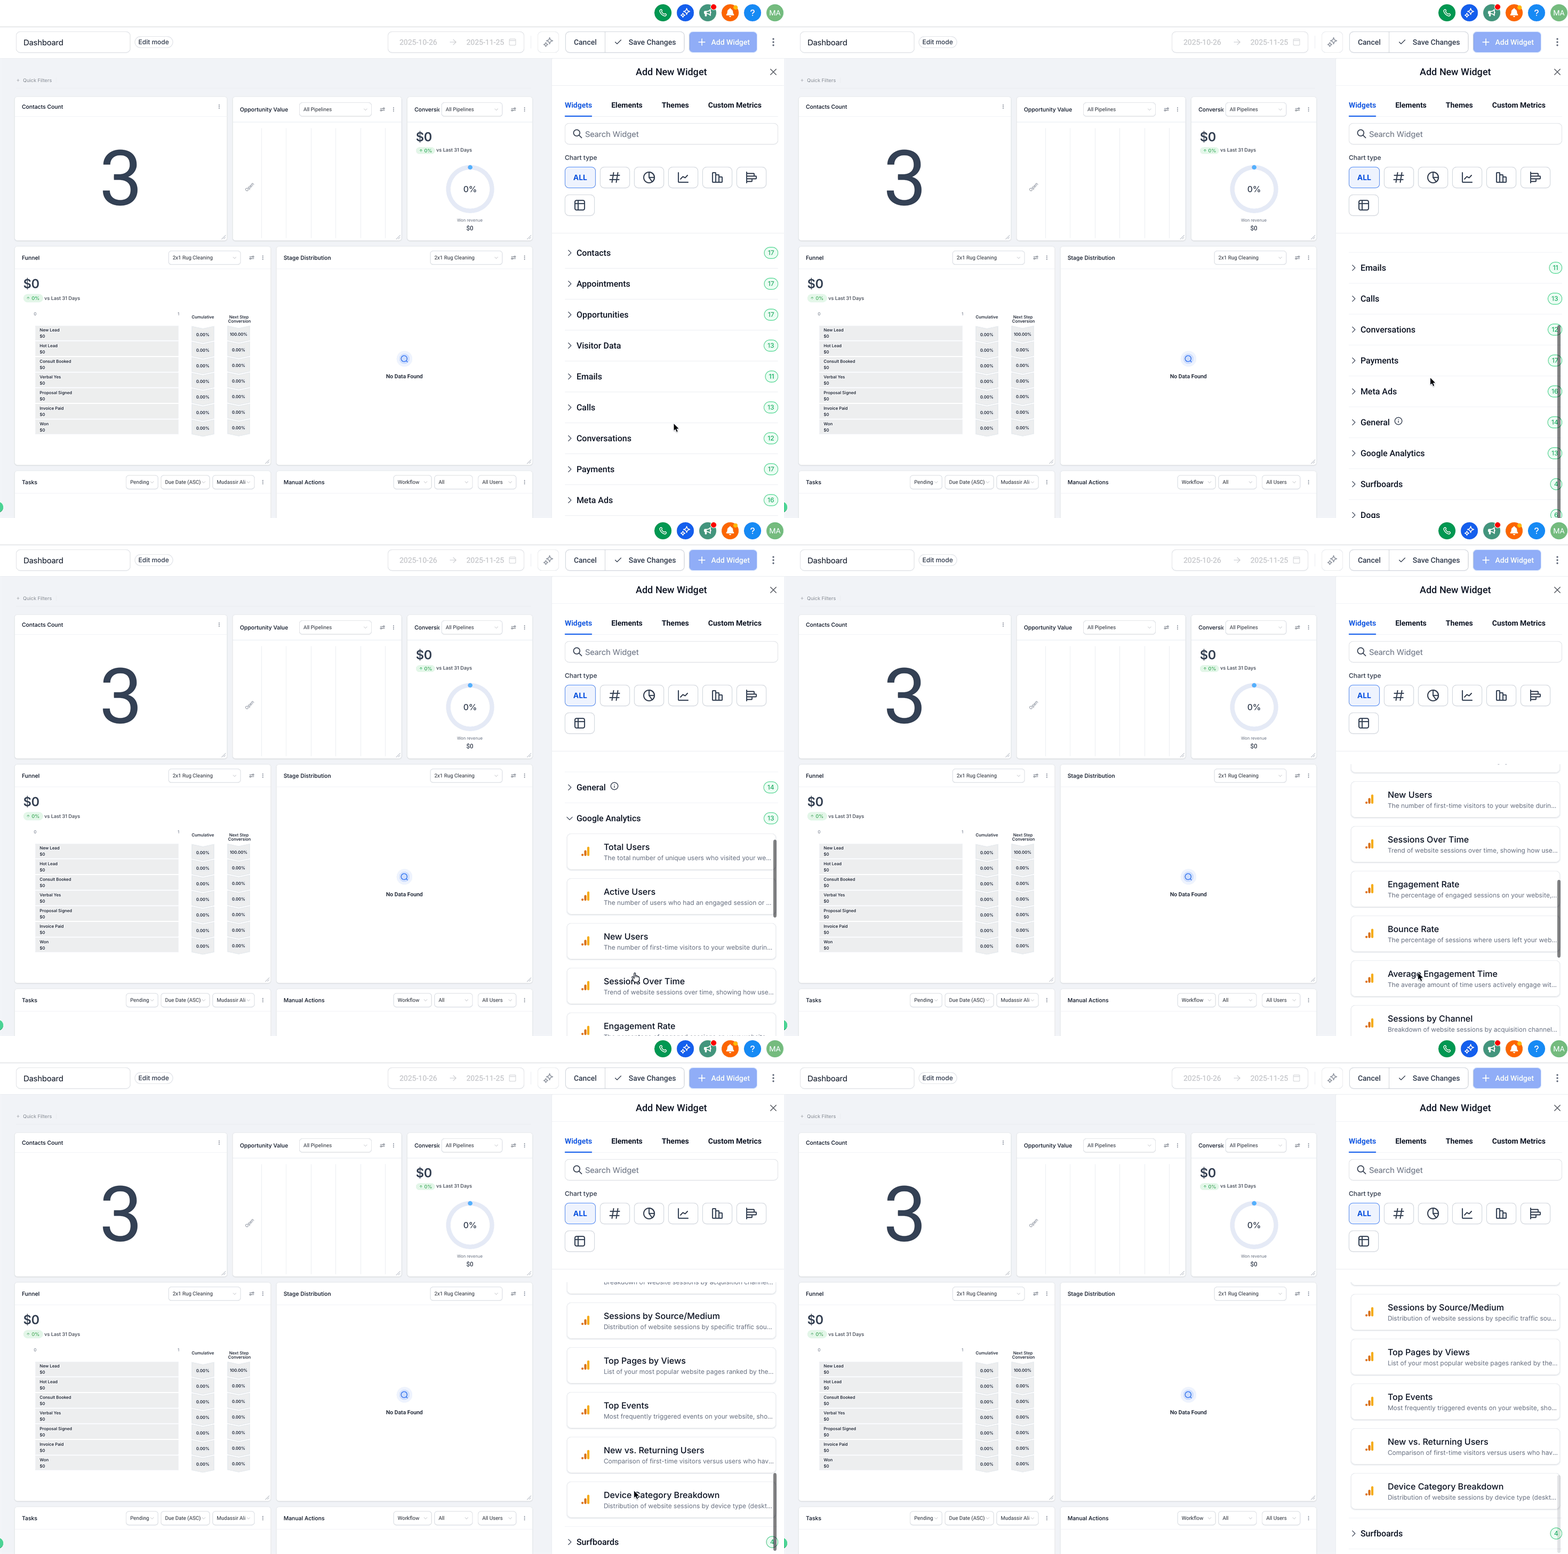
Choose a chart type (Numeric, Donut, Line, Bar, or Table), then scroll to the Google Analytics category and select the metric or “Top” widget you want to add.
Apply filters (e.g., channel, source/medium, page, date range) or adjust theme/colors if needed.
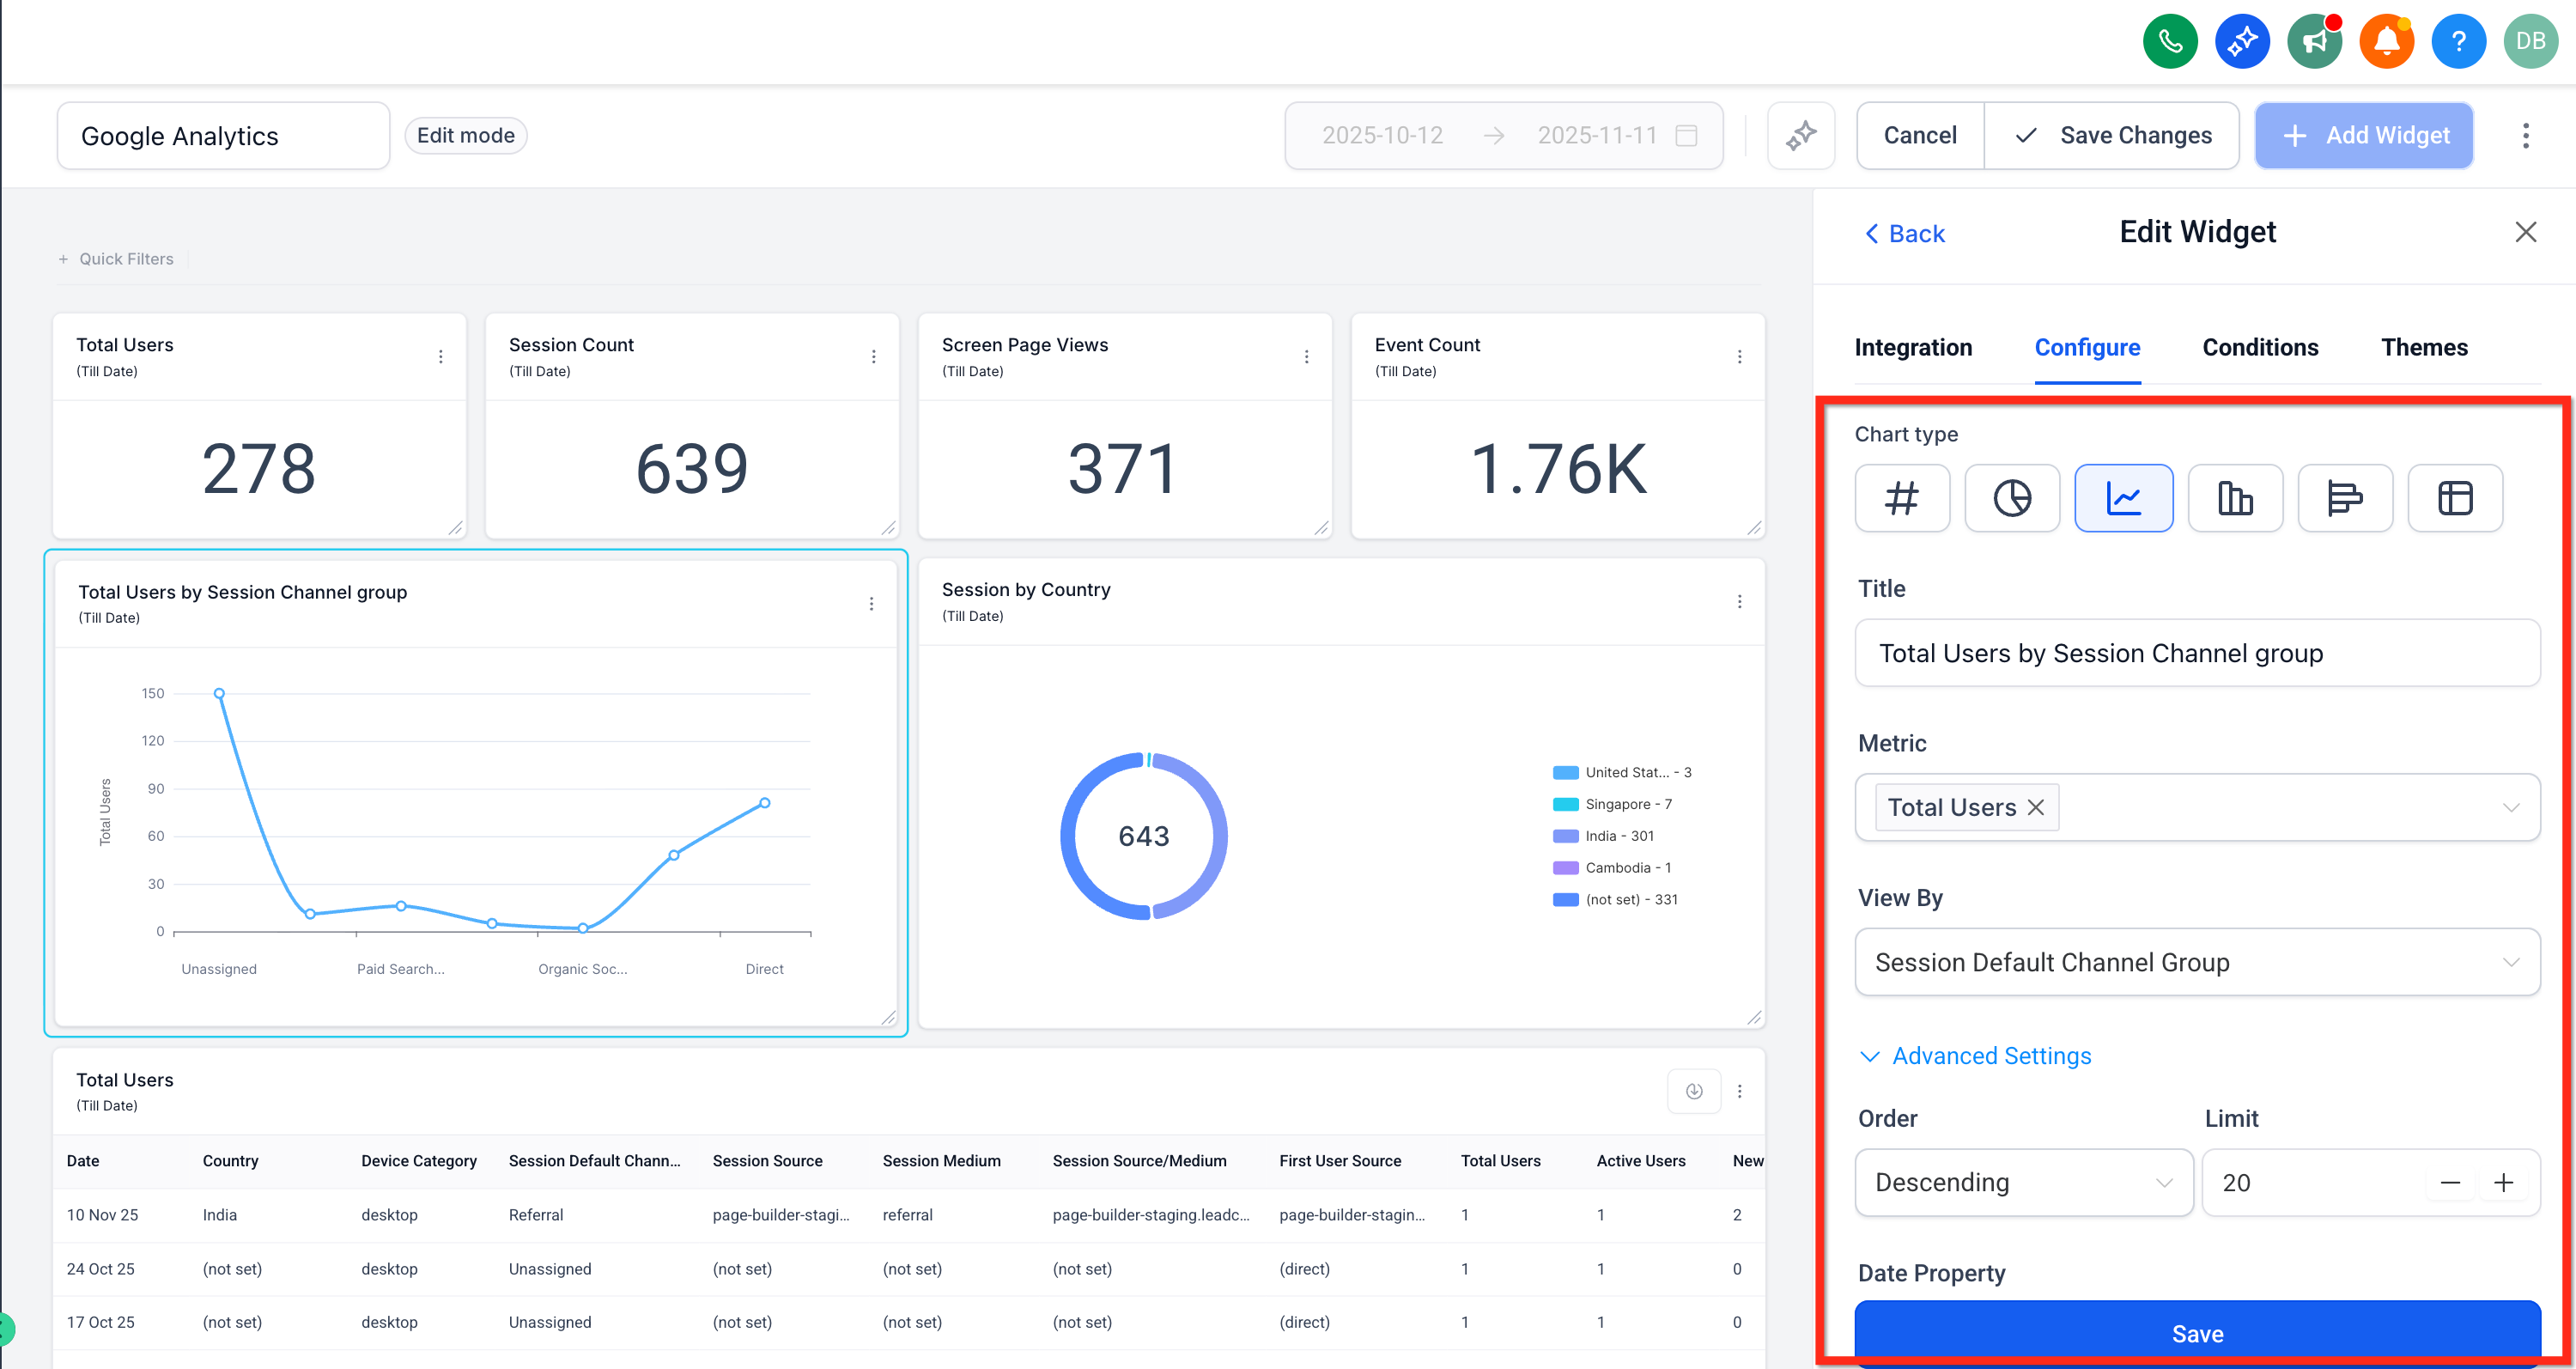
Click Save. The widget begins pulling GA4 data.
Add Widgets to a Custom Report
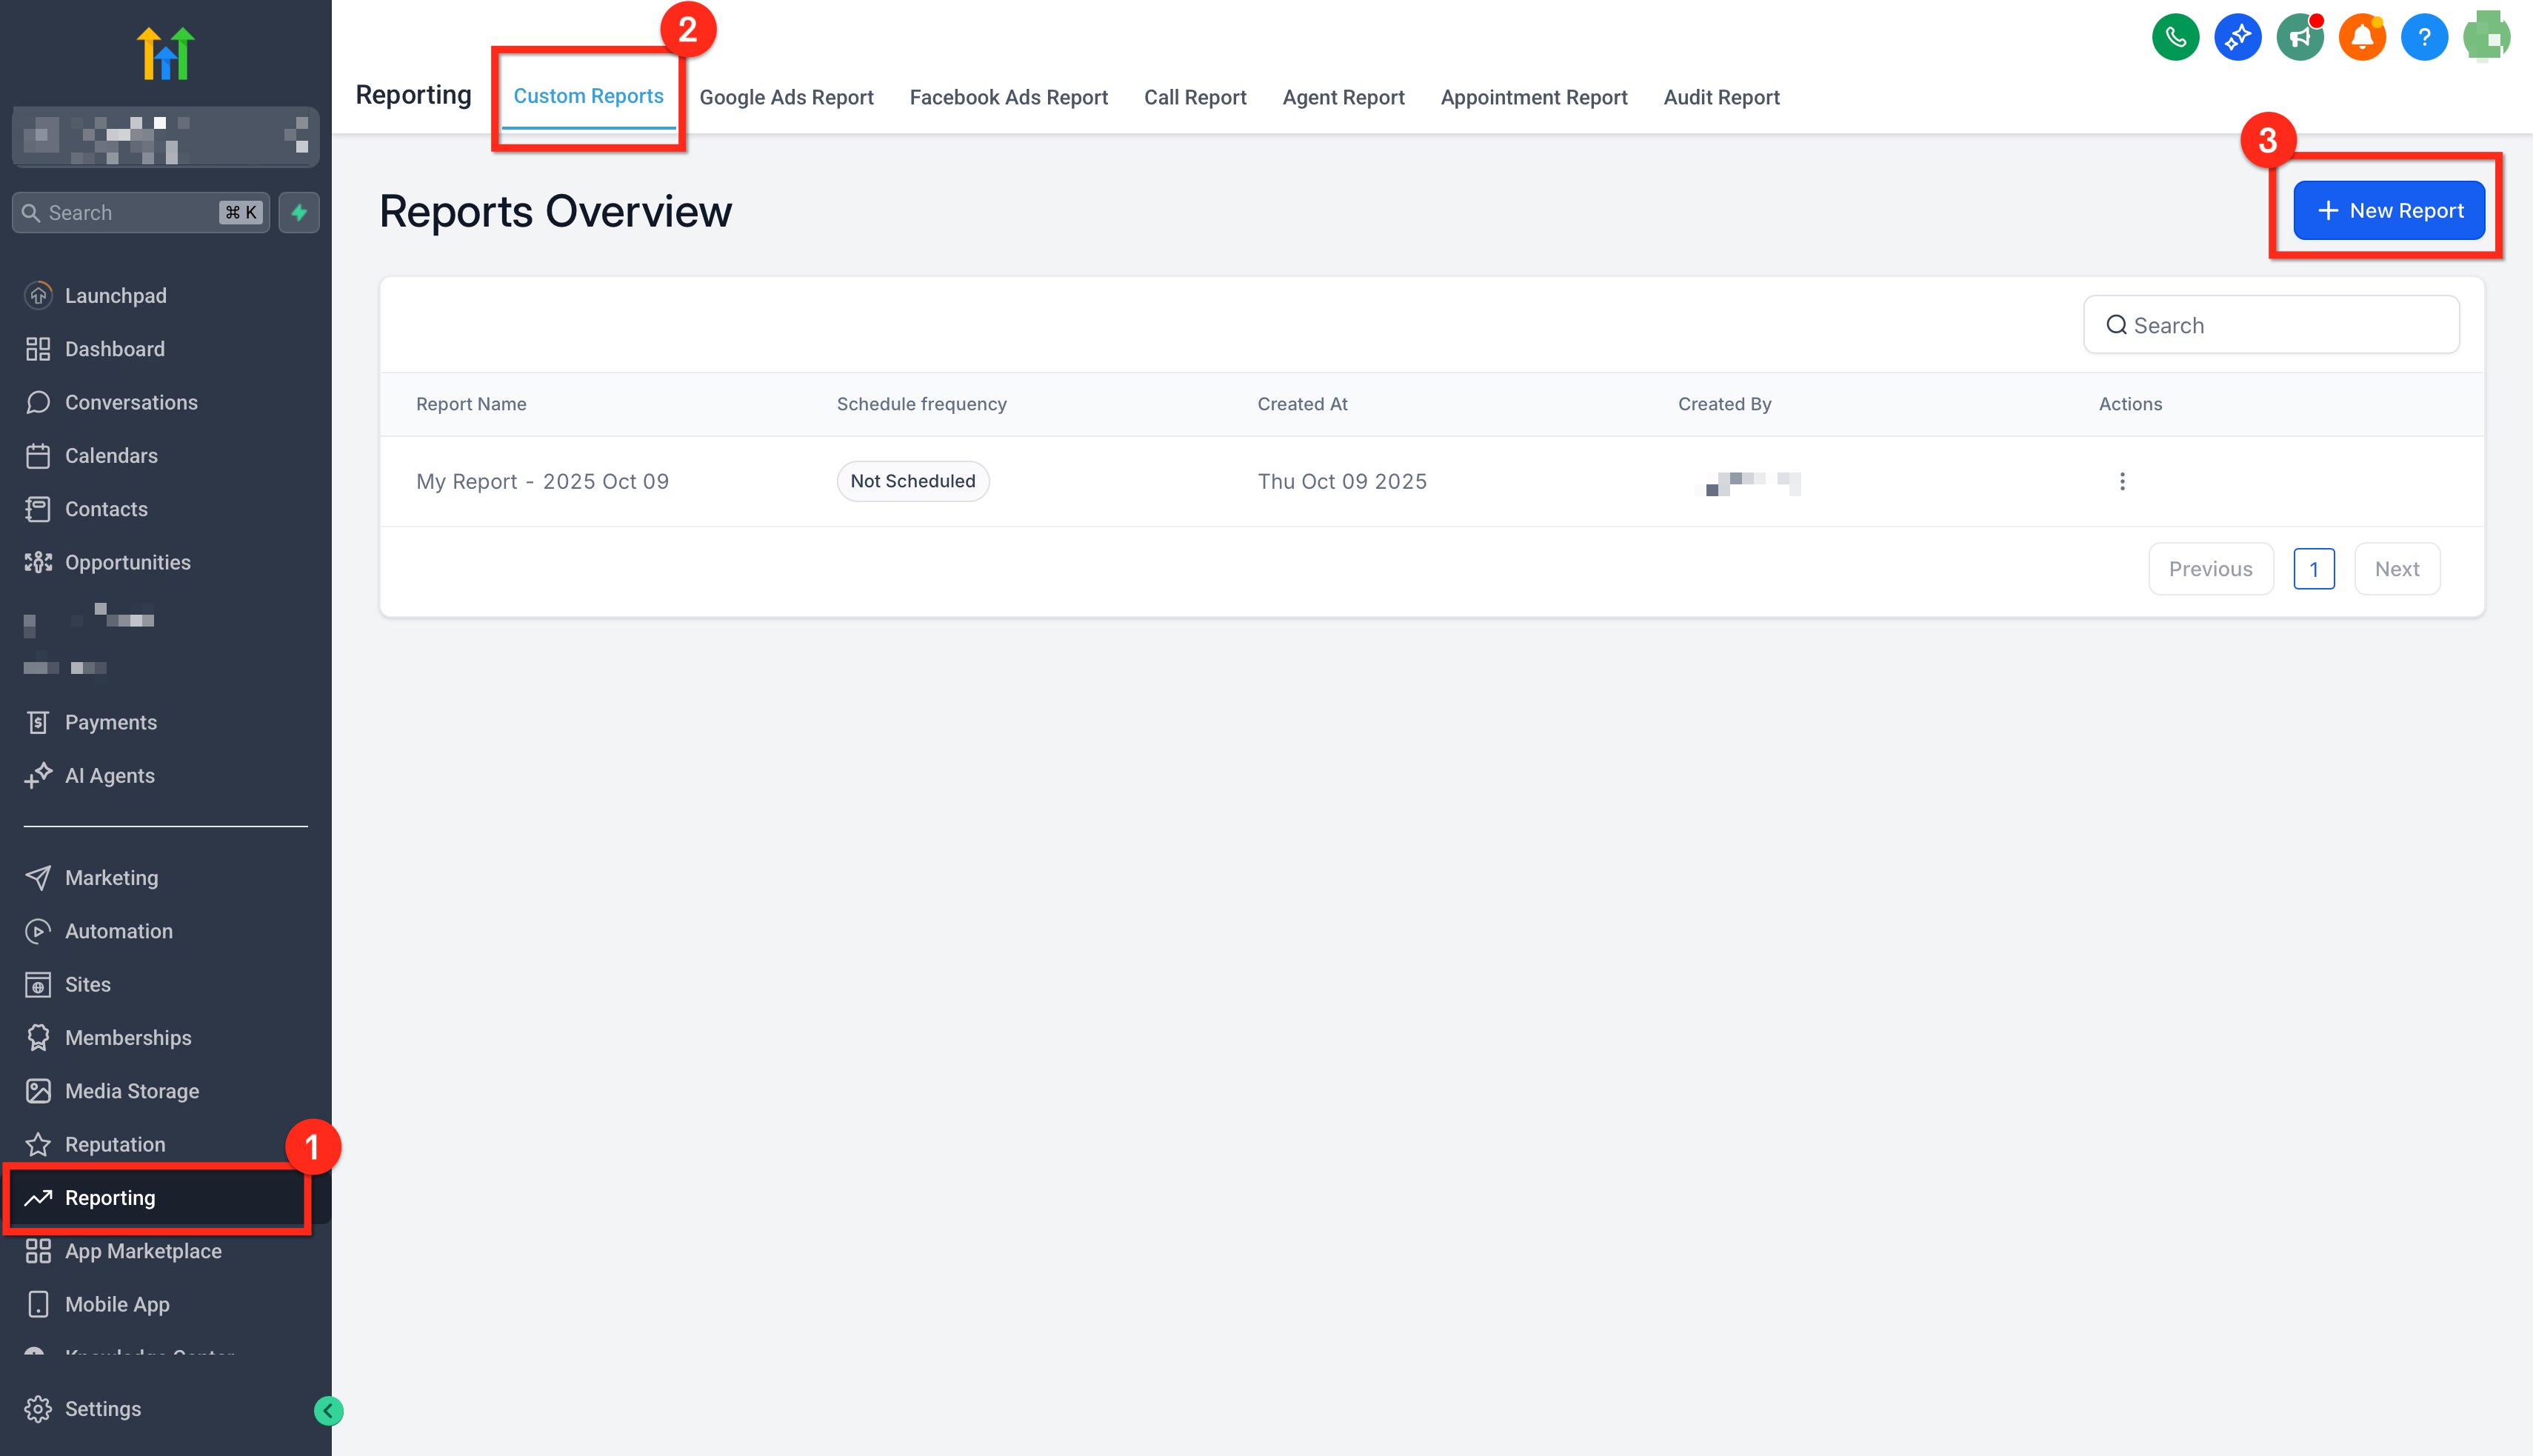
In your Sub‑Account, go to Reporting → Custom Reports, then open an existing report or click New Report.
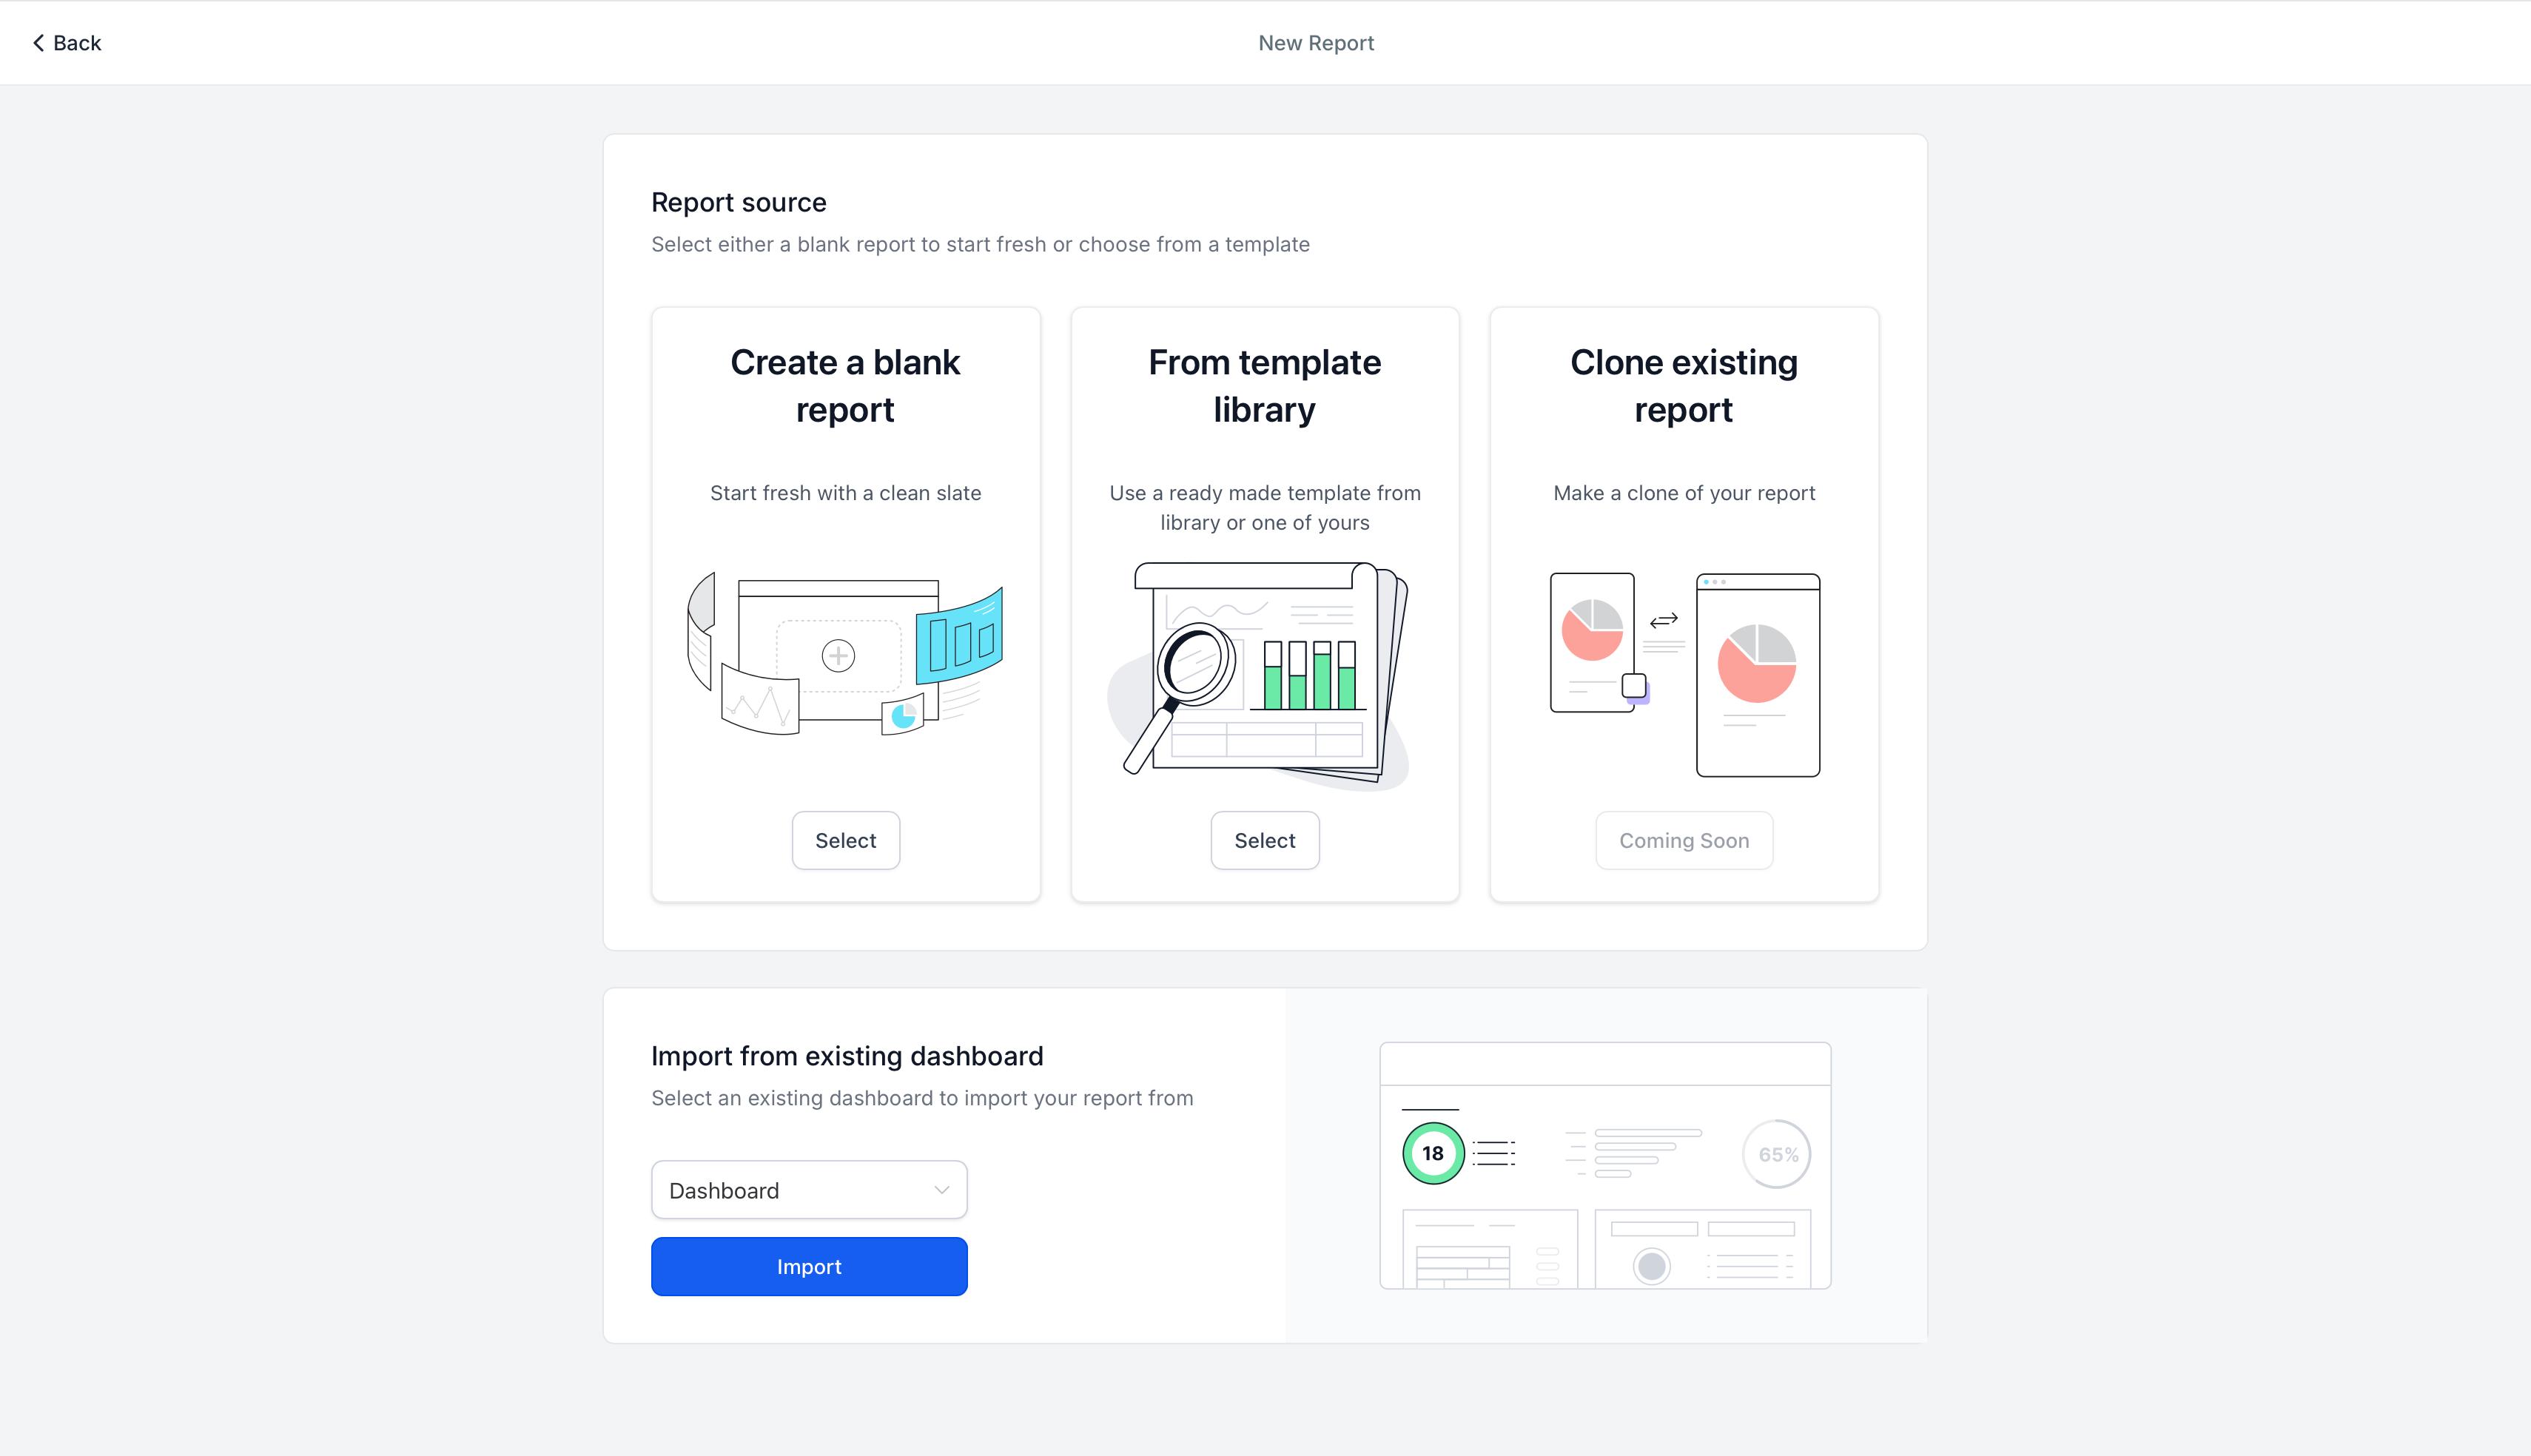
Start from a blank canvas, use a template, or import an existing dashboard layout.
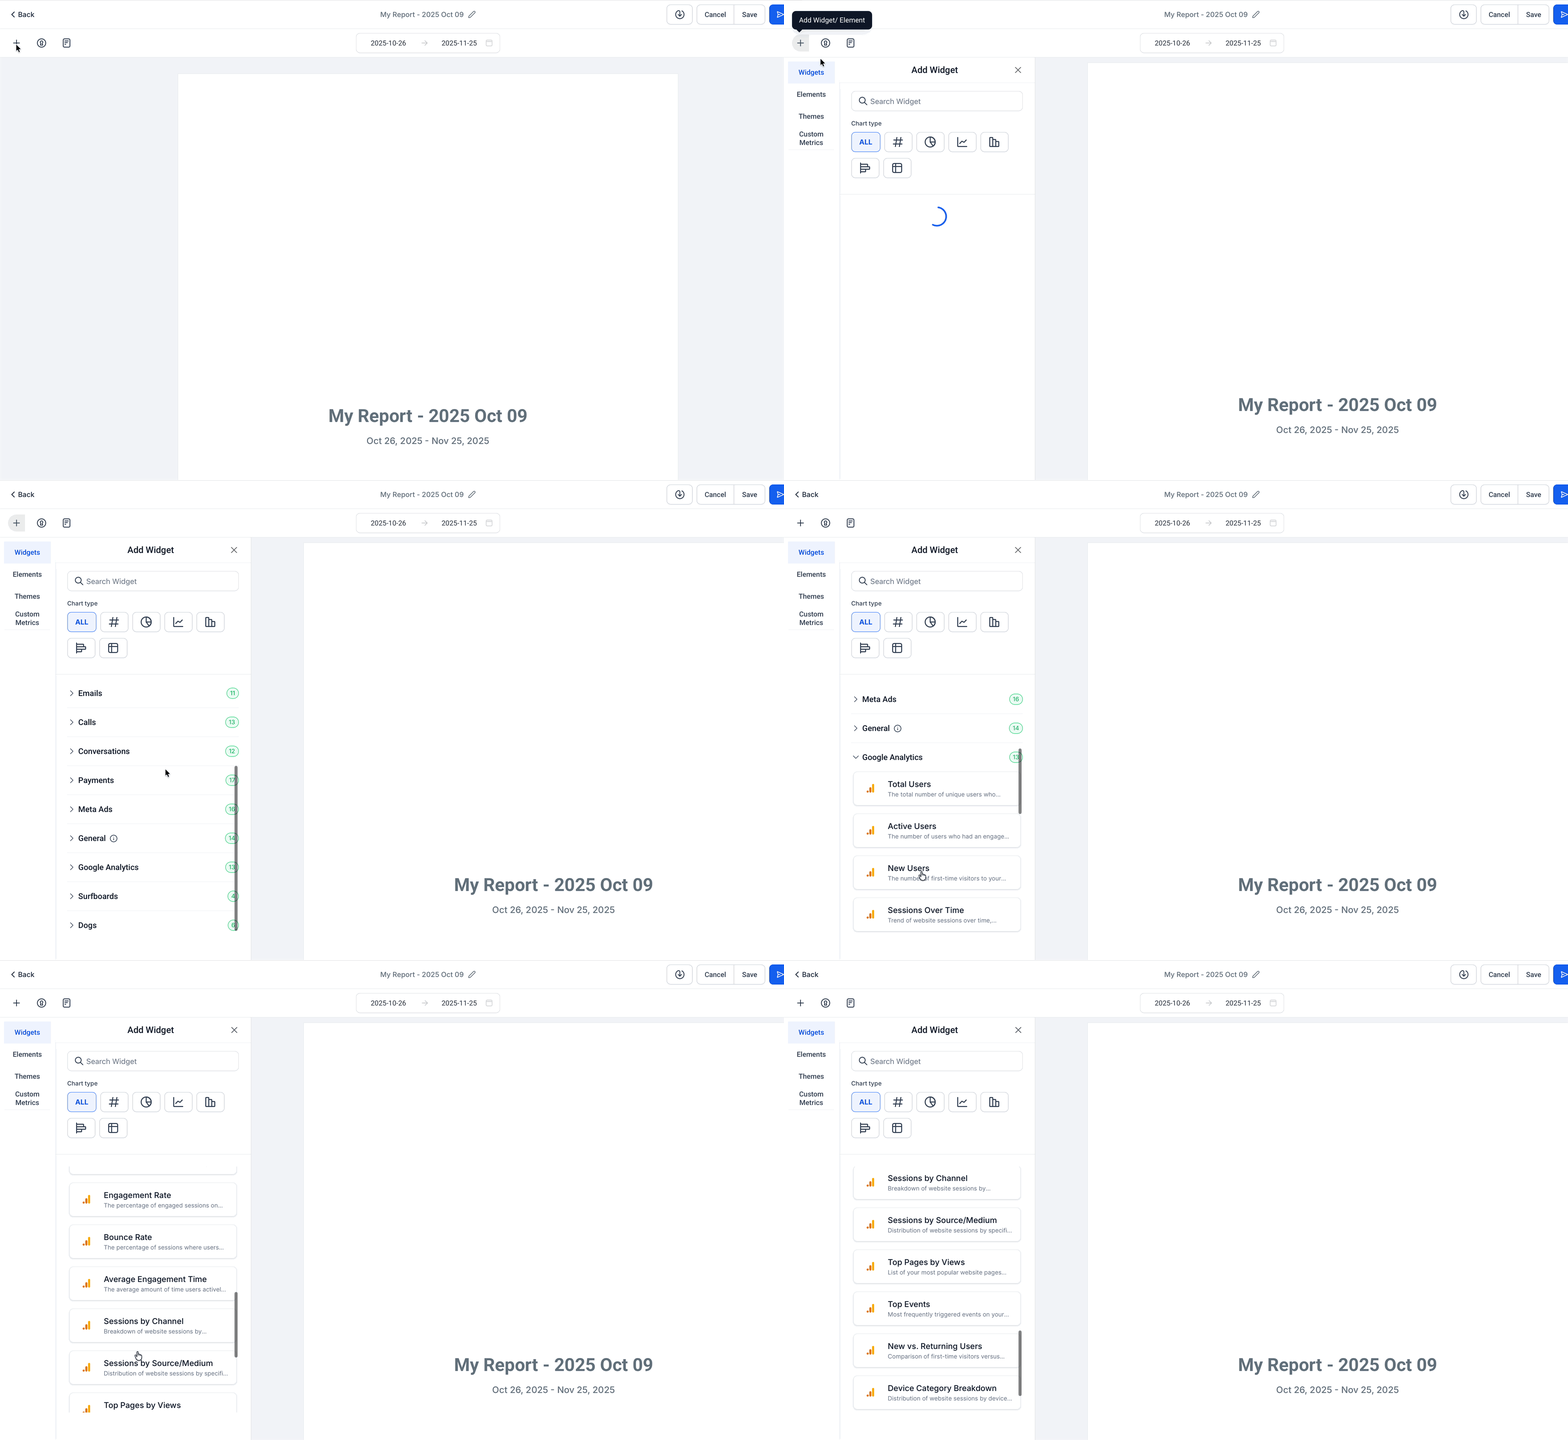
Click Add Widget/Element (top‑left). In the widget list, locate Google Analytics and drag the widgets you want into the layout.
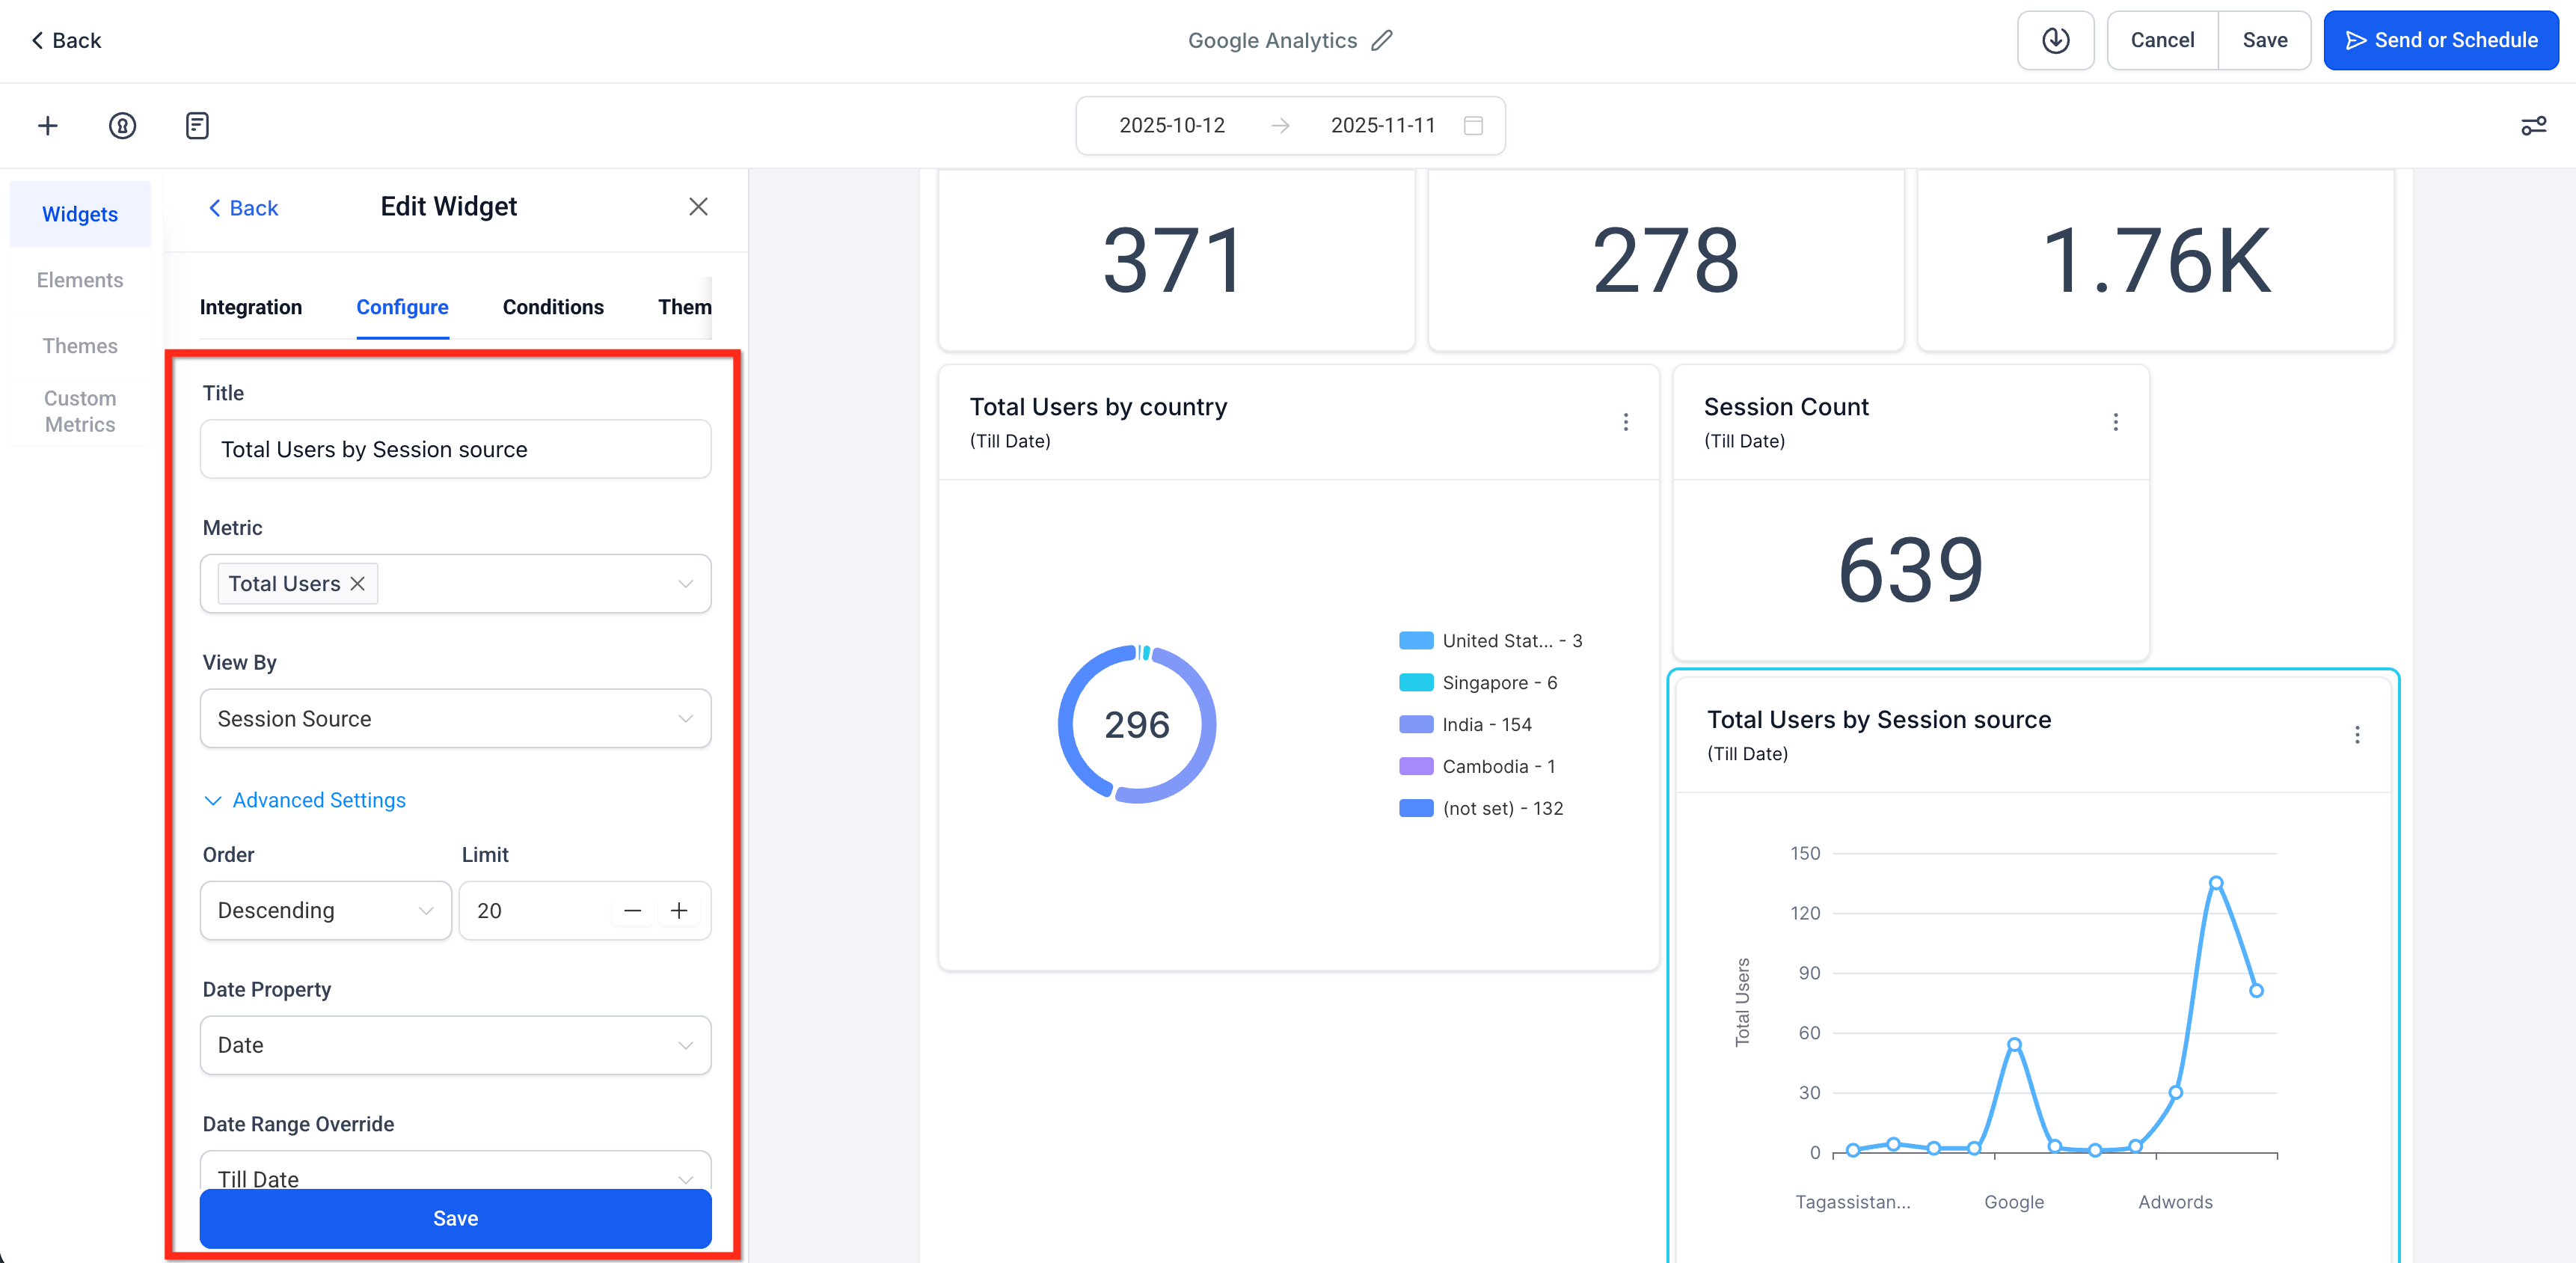
Configure each widget: select chart type, set filters, choose theme, and click Save.
Click Send or Schedule to configure email delivery so recipients receive the report automatically.
Frequently Asked Questions
Q: Which version of Google Analytics is supported?
Google Analytics 4 (GA4). Universal Analytics (UA) is not supported for these widgets.
Q: Why does a widget show “No Data”?
Check that the GA4 property is connected, widen the date range, and review filters (for example, a restrictive Source/Medium or a page path that has no traffic).
Q: Can I duplicate and tweak a Google Analytics widget?
Yes. Use duplicate to create a copy, then adjust filters or chart type to compare variants side by side.
Q: Do dashboards and custom reports use different GA data?
No. Both surfaces read from your connected GA4 property; choose the surface based on monitoring vs. scheduling needs.
Q: Can I mix GA widgets with ads and CRM metrics?
Yes. Combine GA4 widgets with Meta Ads, Google Ads, and CRM widgets to tell a complete acquisition‑to‑revenue story.
Q: What permissions are required to add GA widgets?
Users need the ability to connect integrations (as applicable) and to Edit dashboards or Create/Schedule reports. View‑only users can see shared dashboards and received reports.