
Our analytics give you a clear, no‑fluff view of how forms and surveys perform over time. Track views, responses, completion rate, average time, and (for surveys) slide‑level views and drop‑off so you can spot friction and improve conversions fast.
TABLE OF CONTENTS
- Overview
- Key Benefits
- Available Filters and Metrics
- How to Use the Analytics Dashboard
- Survey Slide‑Level Metrics (Views & Drop‑Off)
- Frequently Asked Questions
- Related Articles
Overview
Analytics for Forms and Surveys provides both at‑a‑glance and deeper insights. From high‑level trends (views, responses, completion) to slide‑level drop‑off in surveys, you’ll see where people fall off and where they jump ahead—so you can fix issues and ship improvements with confidence.
Key Benefits
See performance clearly: Total views, responses, completion rate, and average completion time.
Compare over time: Previous‑period comparison to confirm trends and spot anomalies.
Pinpoint friction: Slide‑level drop‑off highlights where respondents abandon (or jump ahead).
Flexible filters: Focus on a specific form/survey or review all assets over any date range.
Available Filters and Metrics
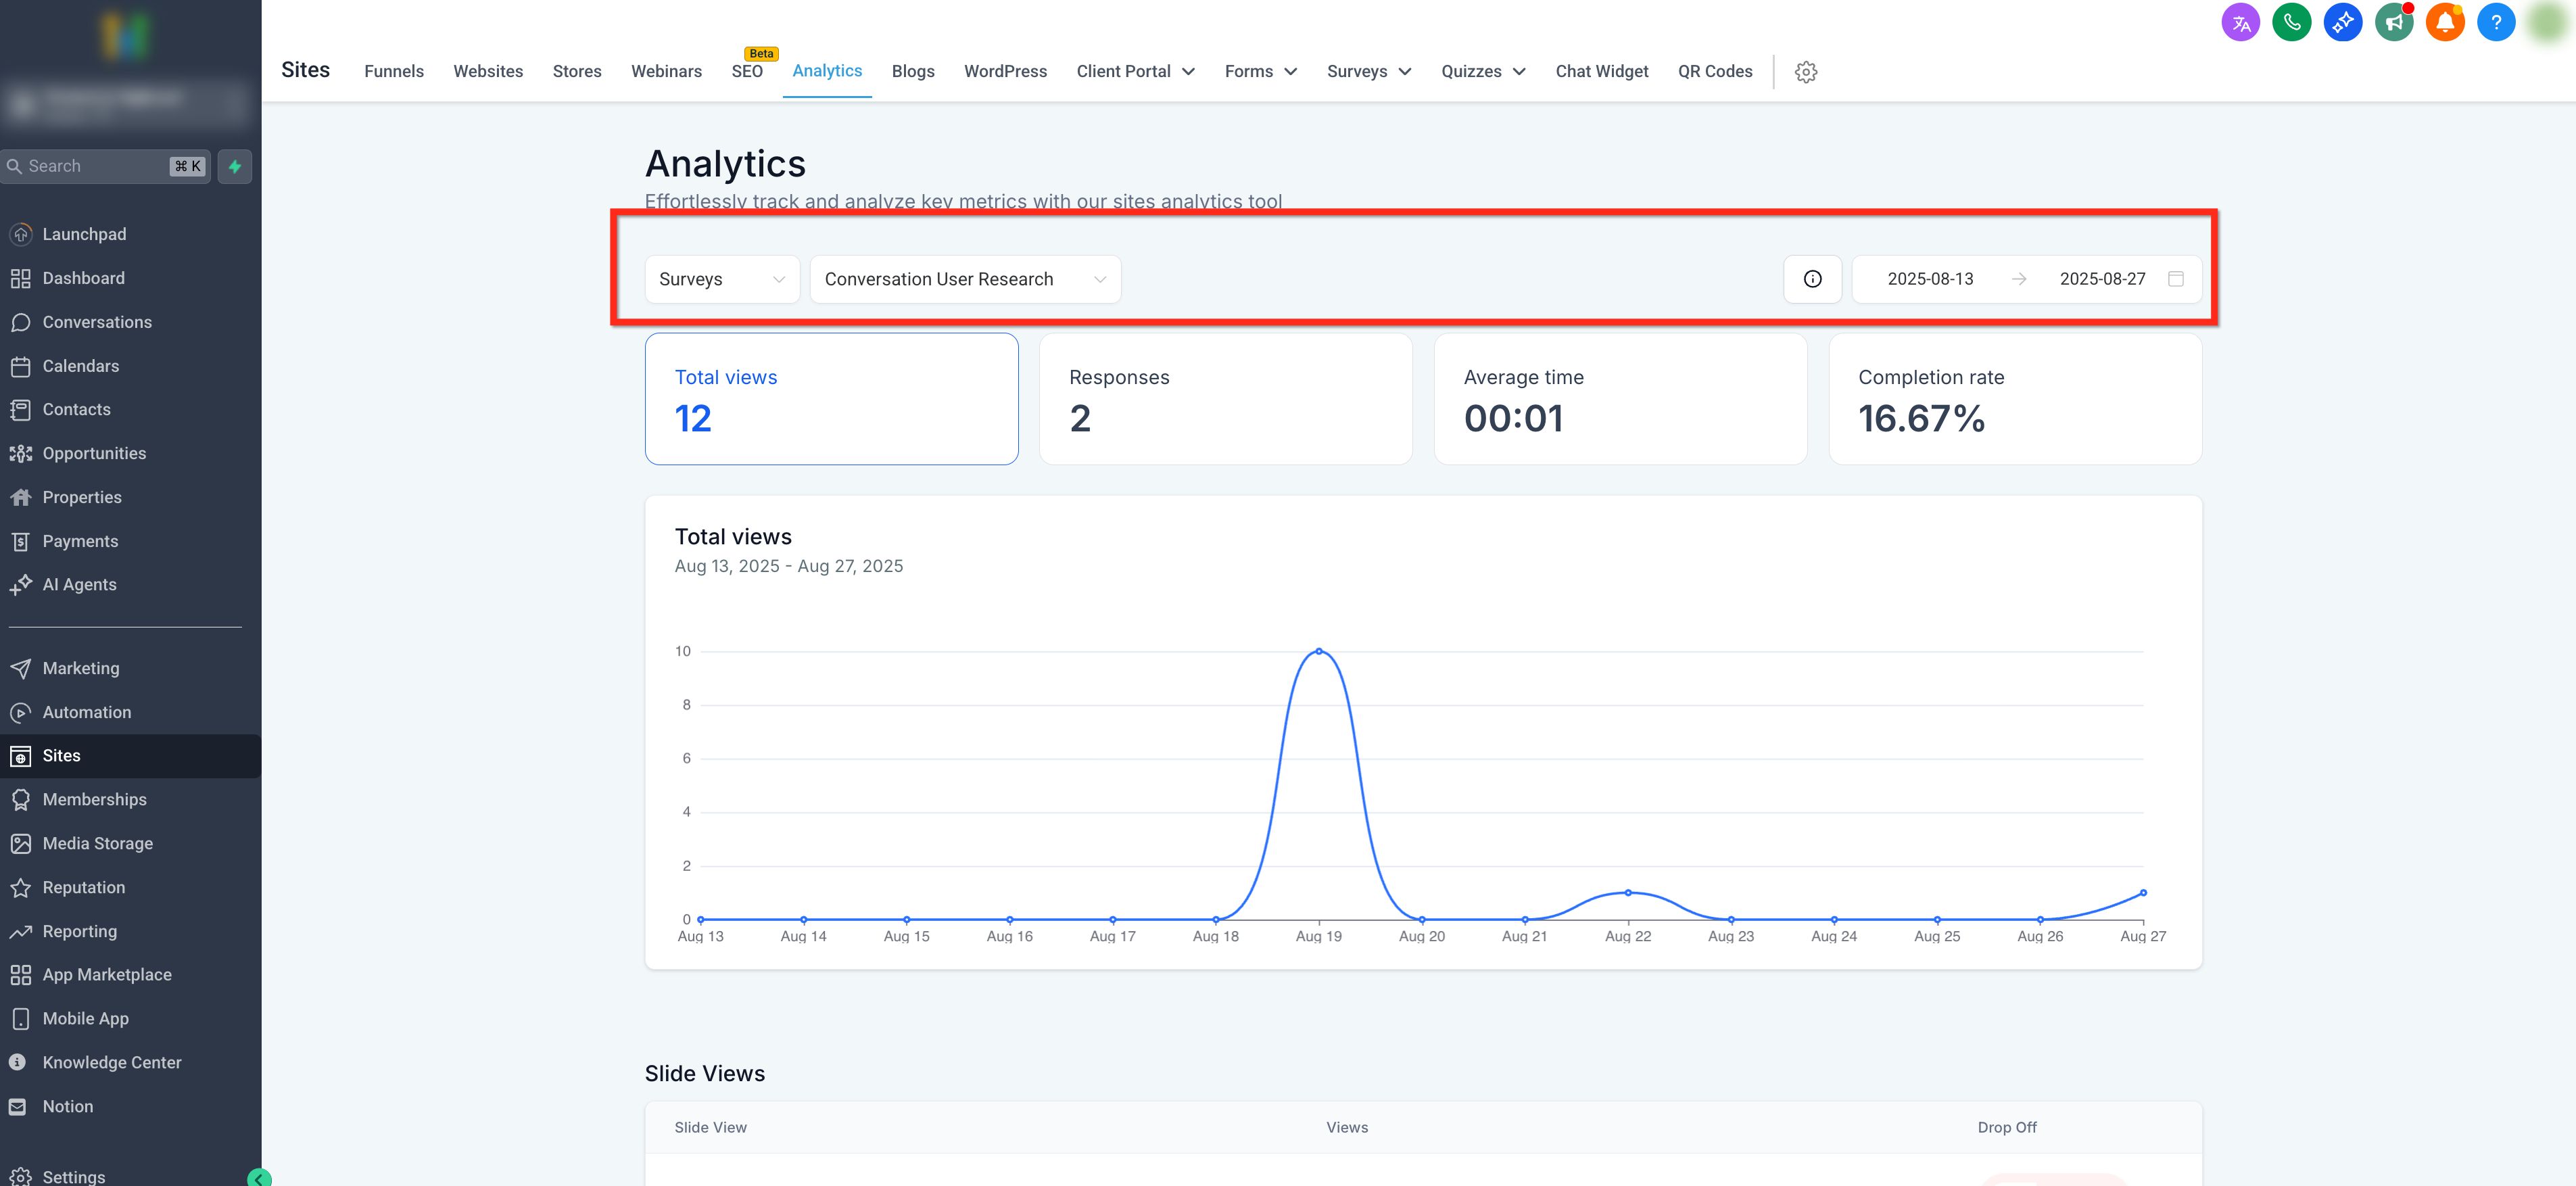
Use filters to focus on the exact asset and timeframe you care about, then read the on-screen metrics to understand engagement, completions, and where users drop off. Pairing the right filters with the right metrics helps you pinpoint issues and validate improvements quickly.
Filters
Type: Forms or Surveys (top‑left)
Asset: All or a specific Form/Survey
Date Range: Presets (Last 7/14/30/60/90 days) or Custom
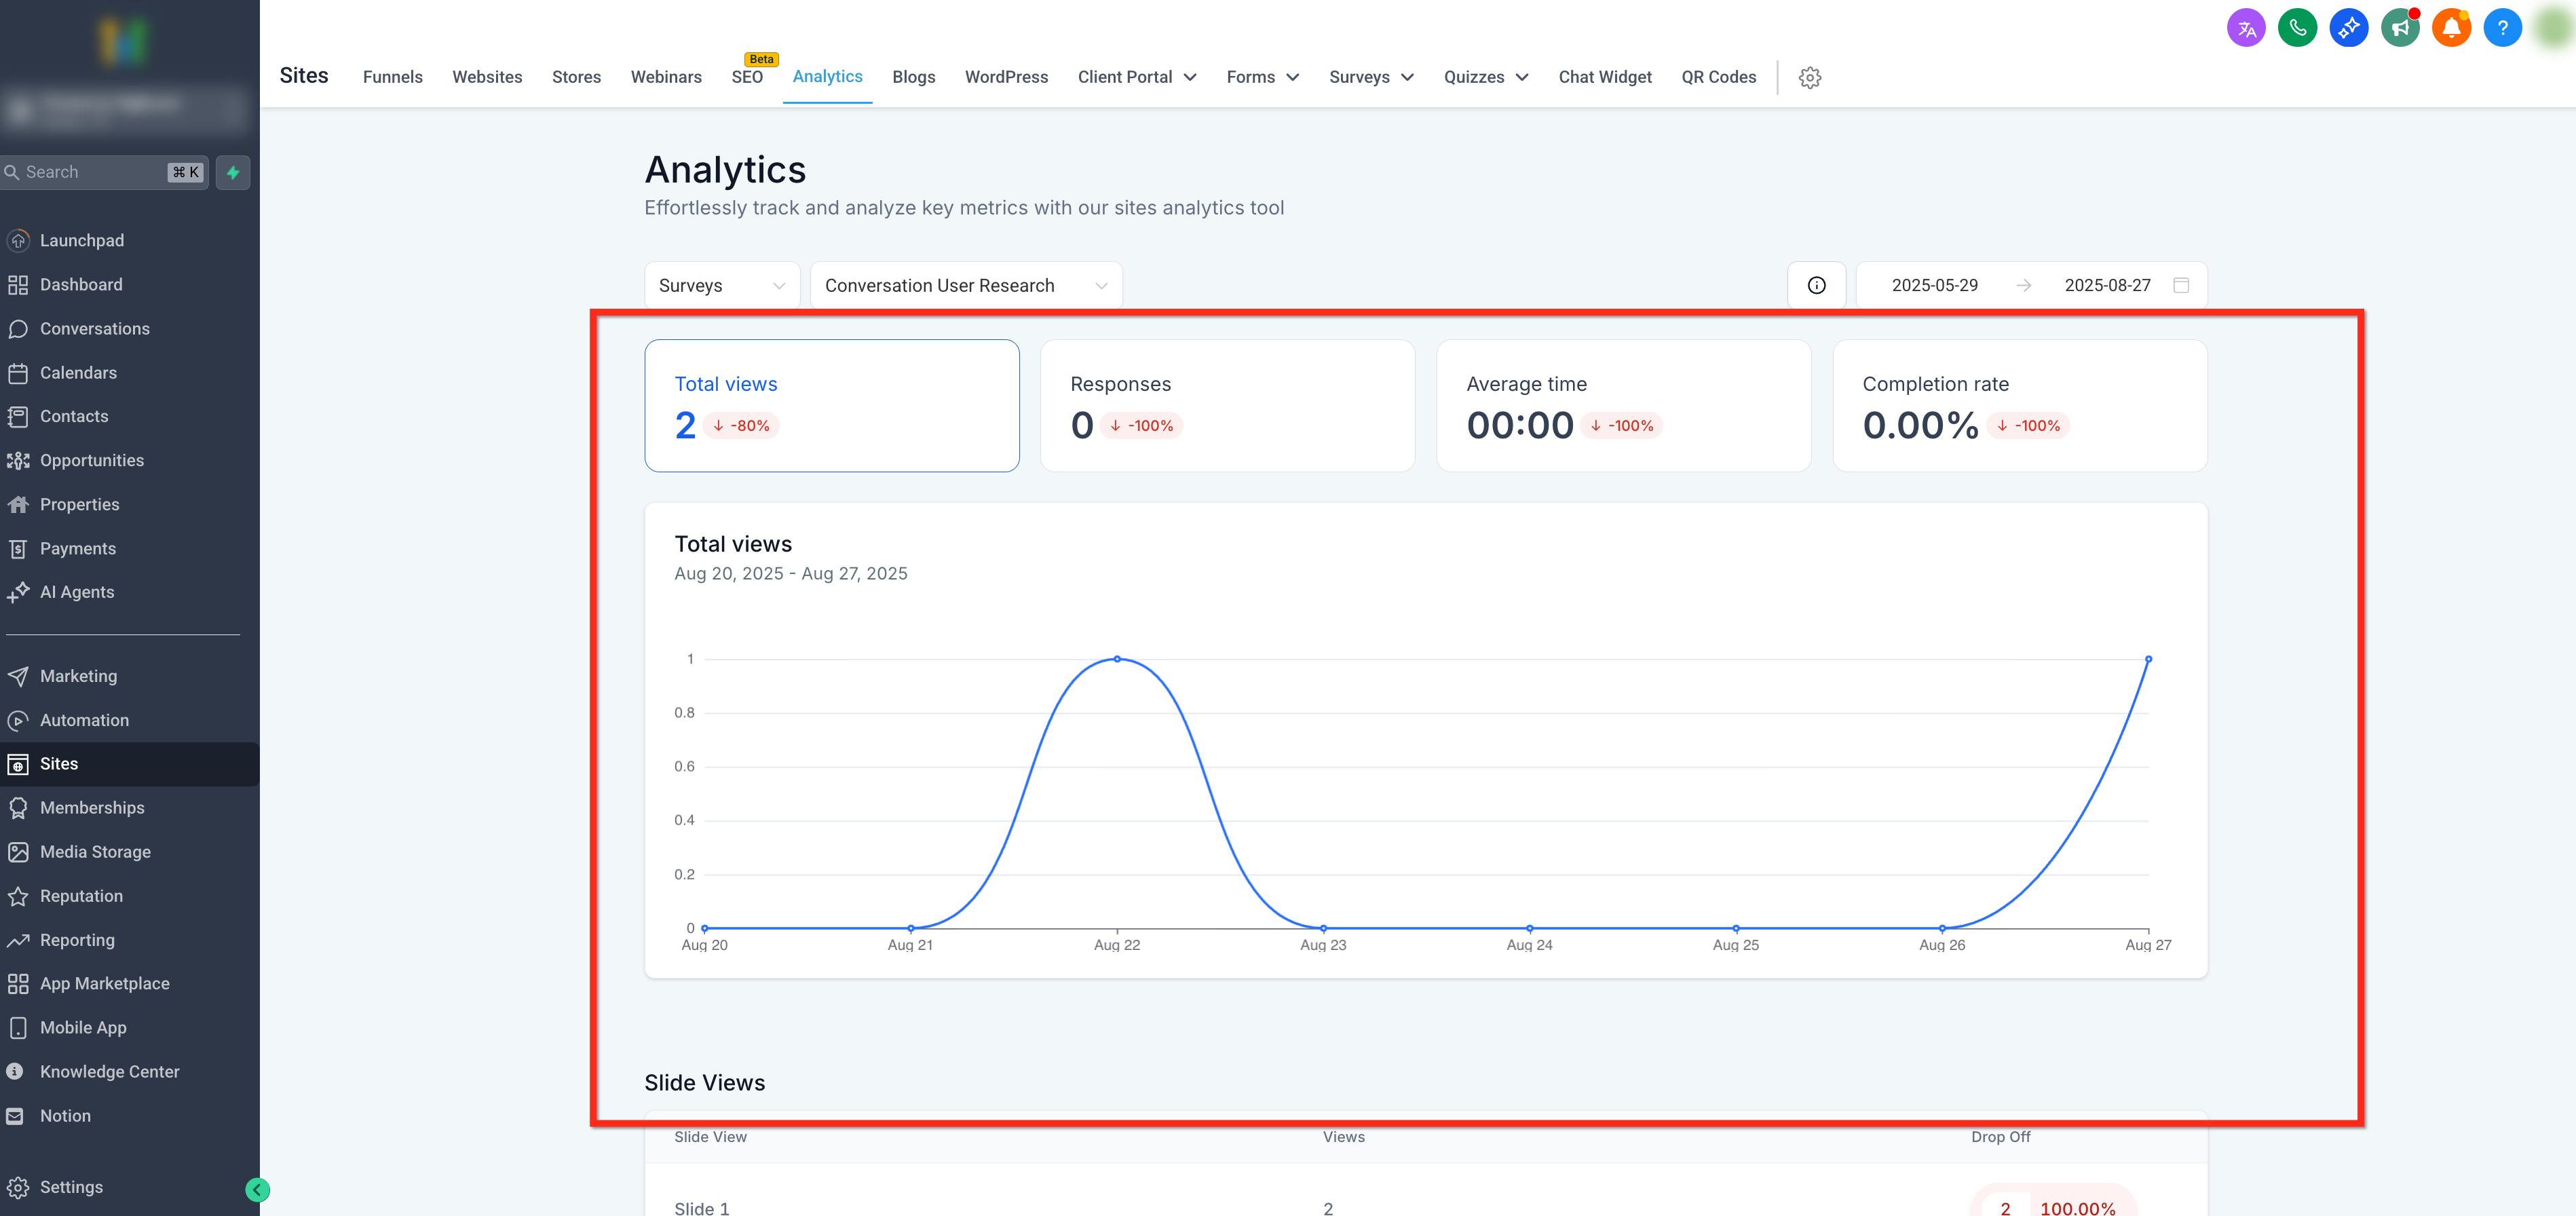
Metrics
Total Views: How many times the selected asset(s) were viewed in the chosen date range
Responses: Completed submissions
Average Time: Average completion time
Completion Rate: % of responses vs views, with an automatic previous‑period comparison
Total Views chart: Line chart to spot increases or declines
Per‑Asset Breakdown: Table of Total Views per Form/Survey (shown when viewing All assets)
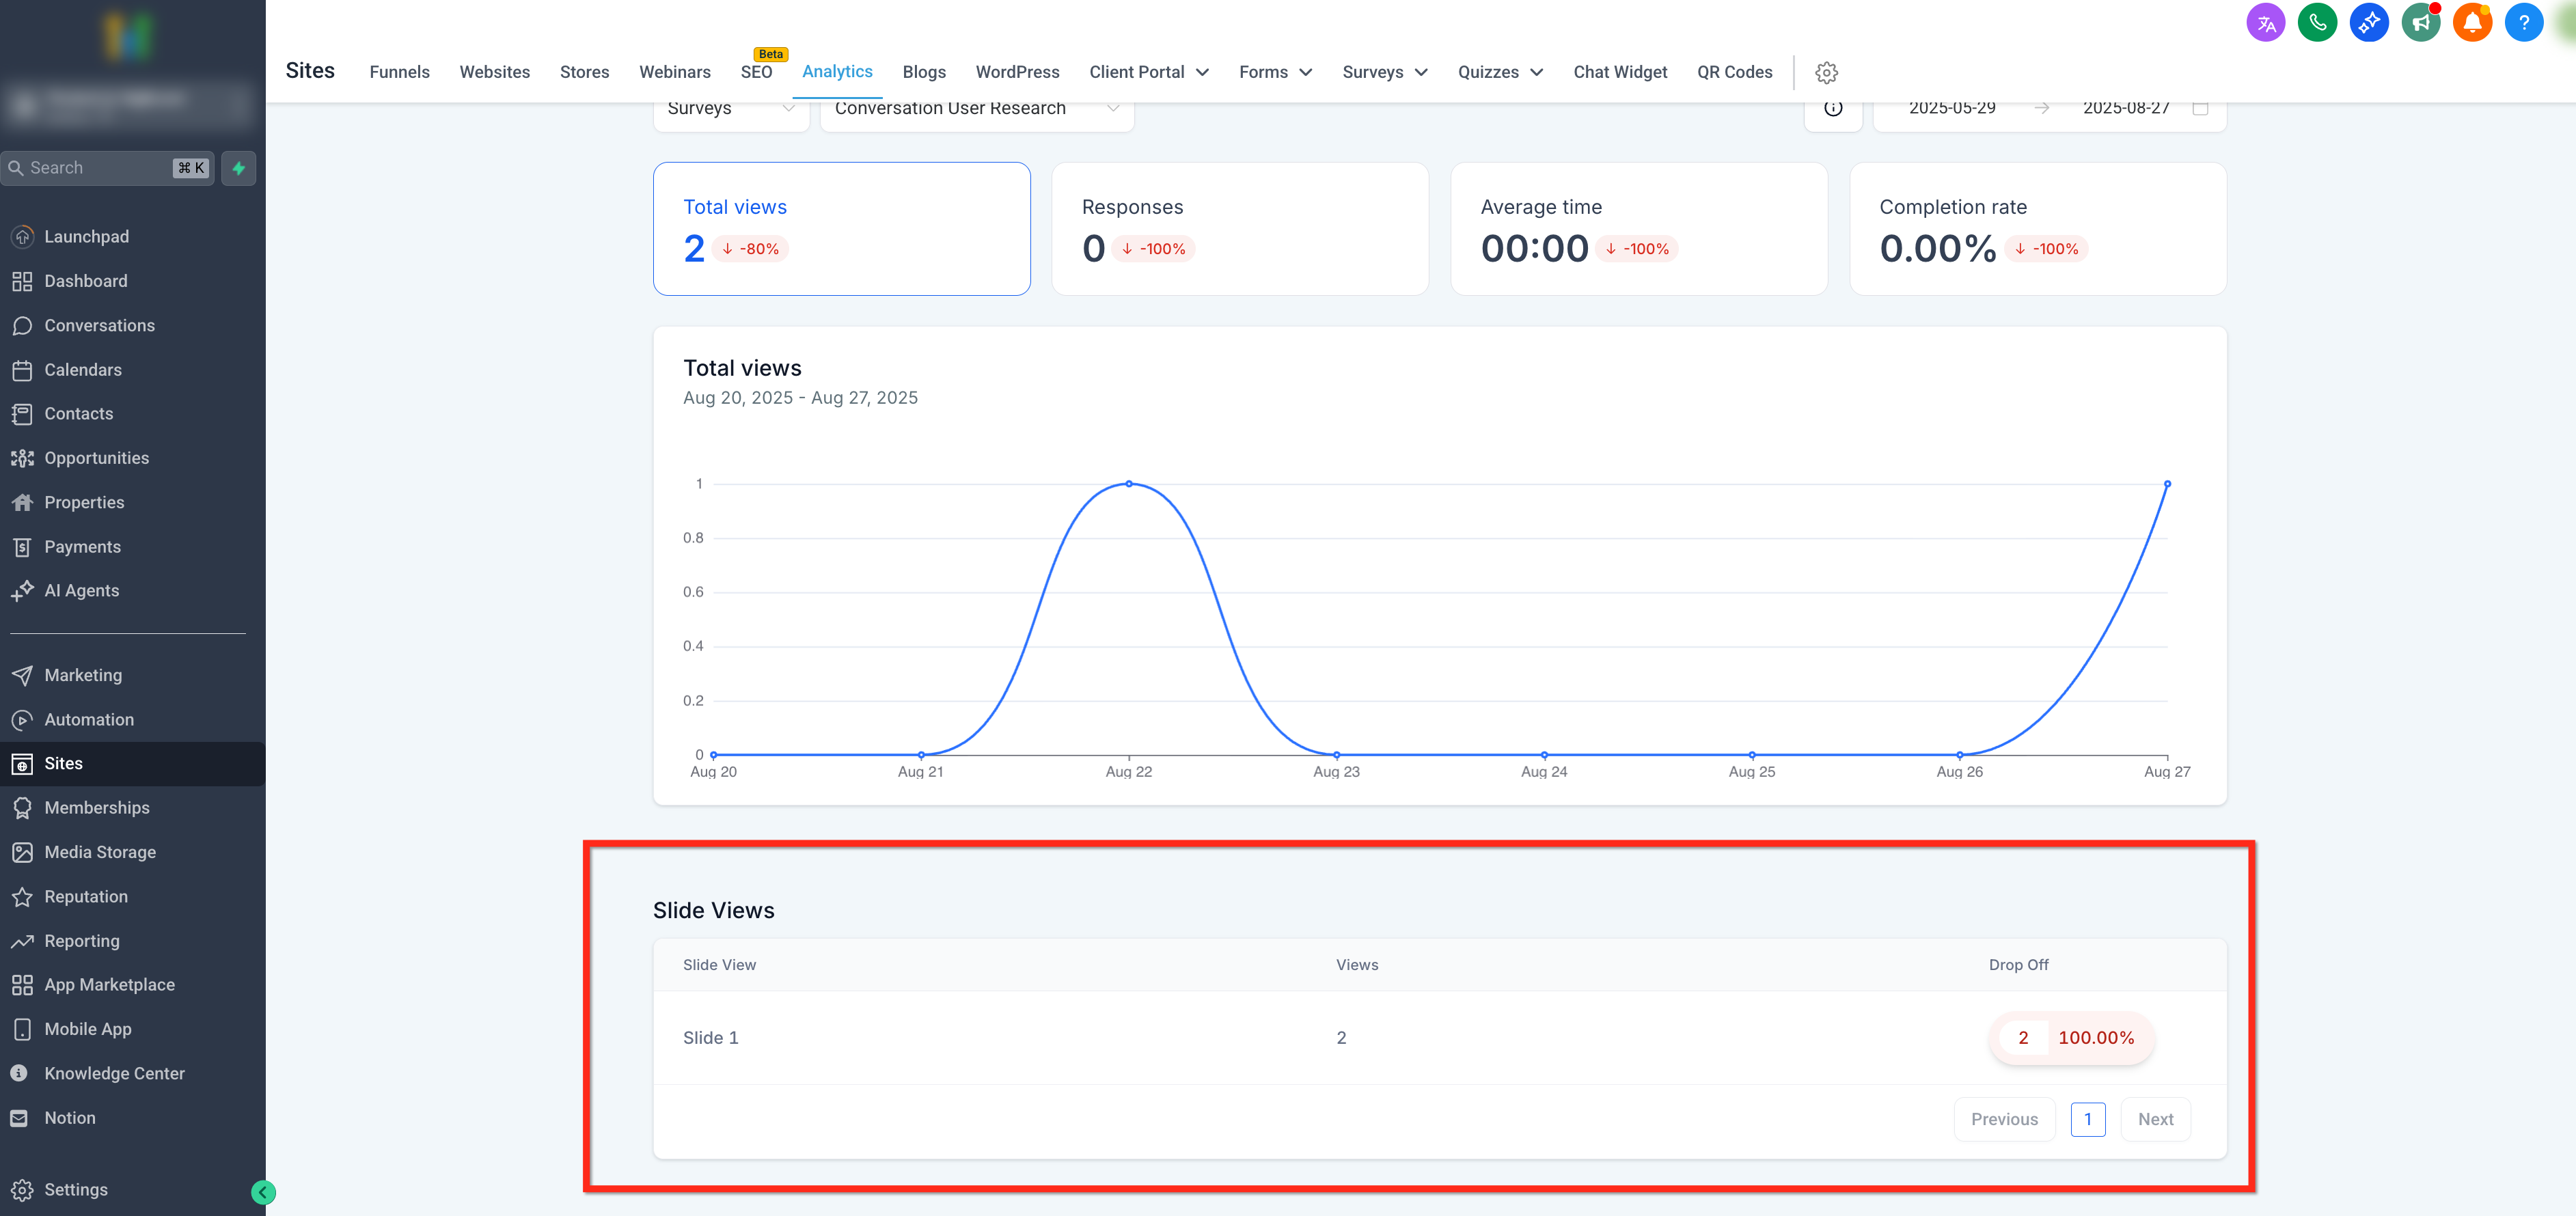
- Survey Views: Only available for Surveys and only when a single survey is selected in the filter
Slide View: The step within the survey metrics refer to
Views: How many respondents reached that slide
Drop-Off: How many exited on that slide (Count followed by the percentage). Use this to identify slides that should be improved and tested
How to Use the Analytics Dashboard
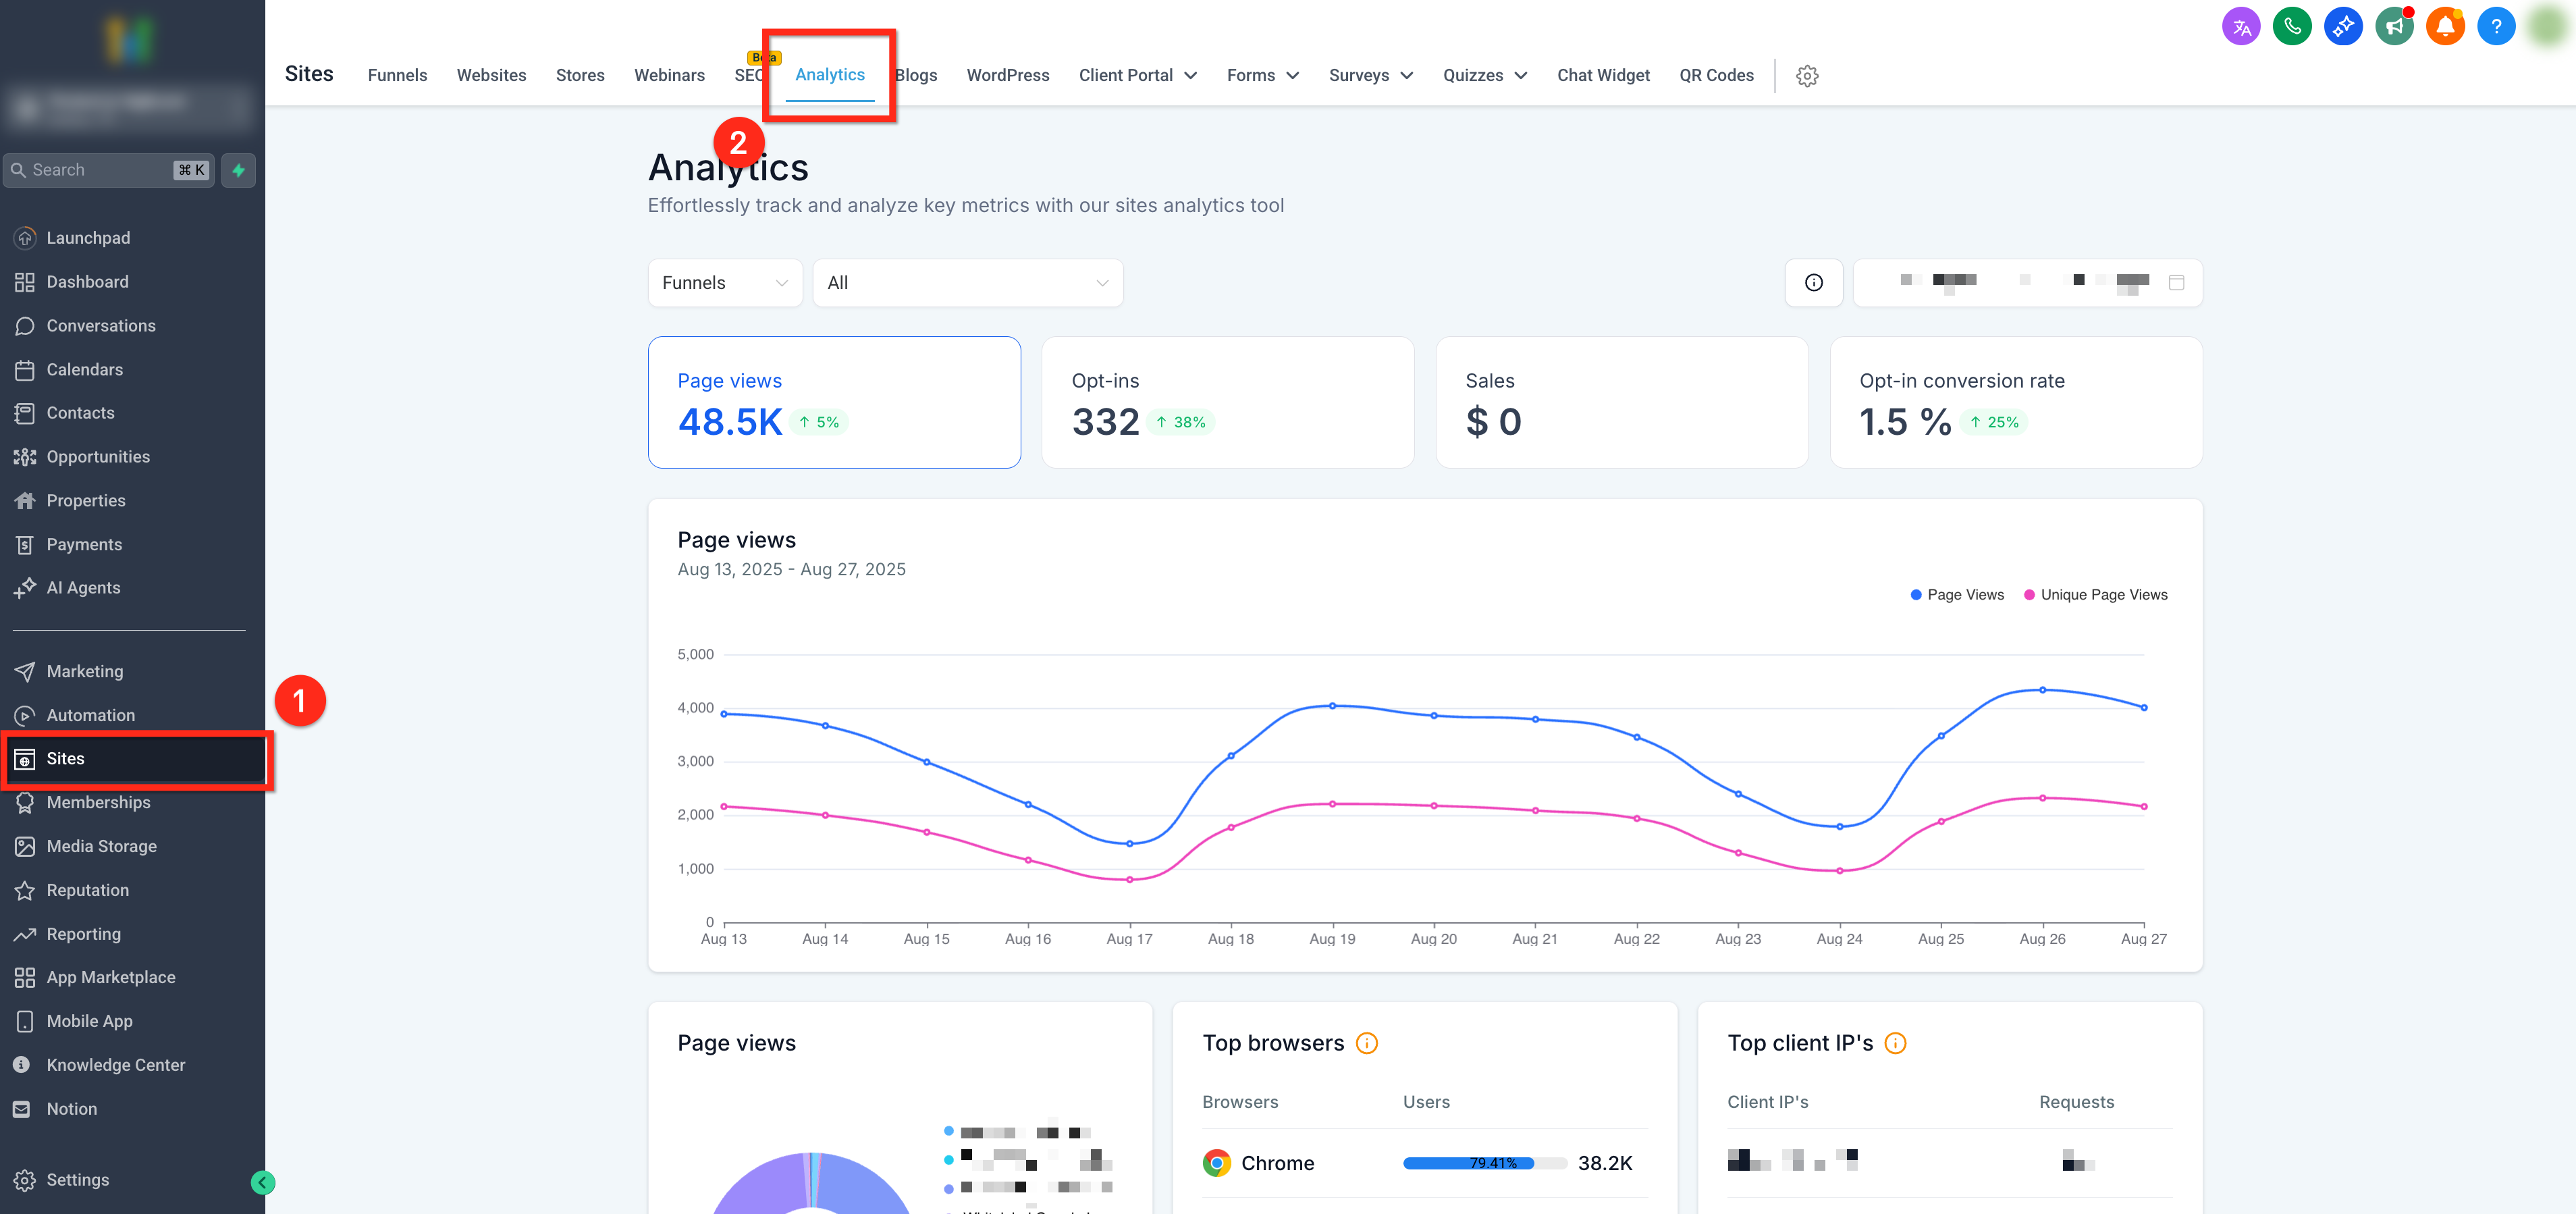
Navigate: From the left menu, go to Sites → top navigation Analytics.
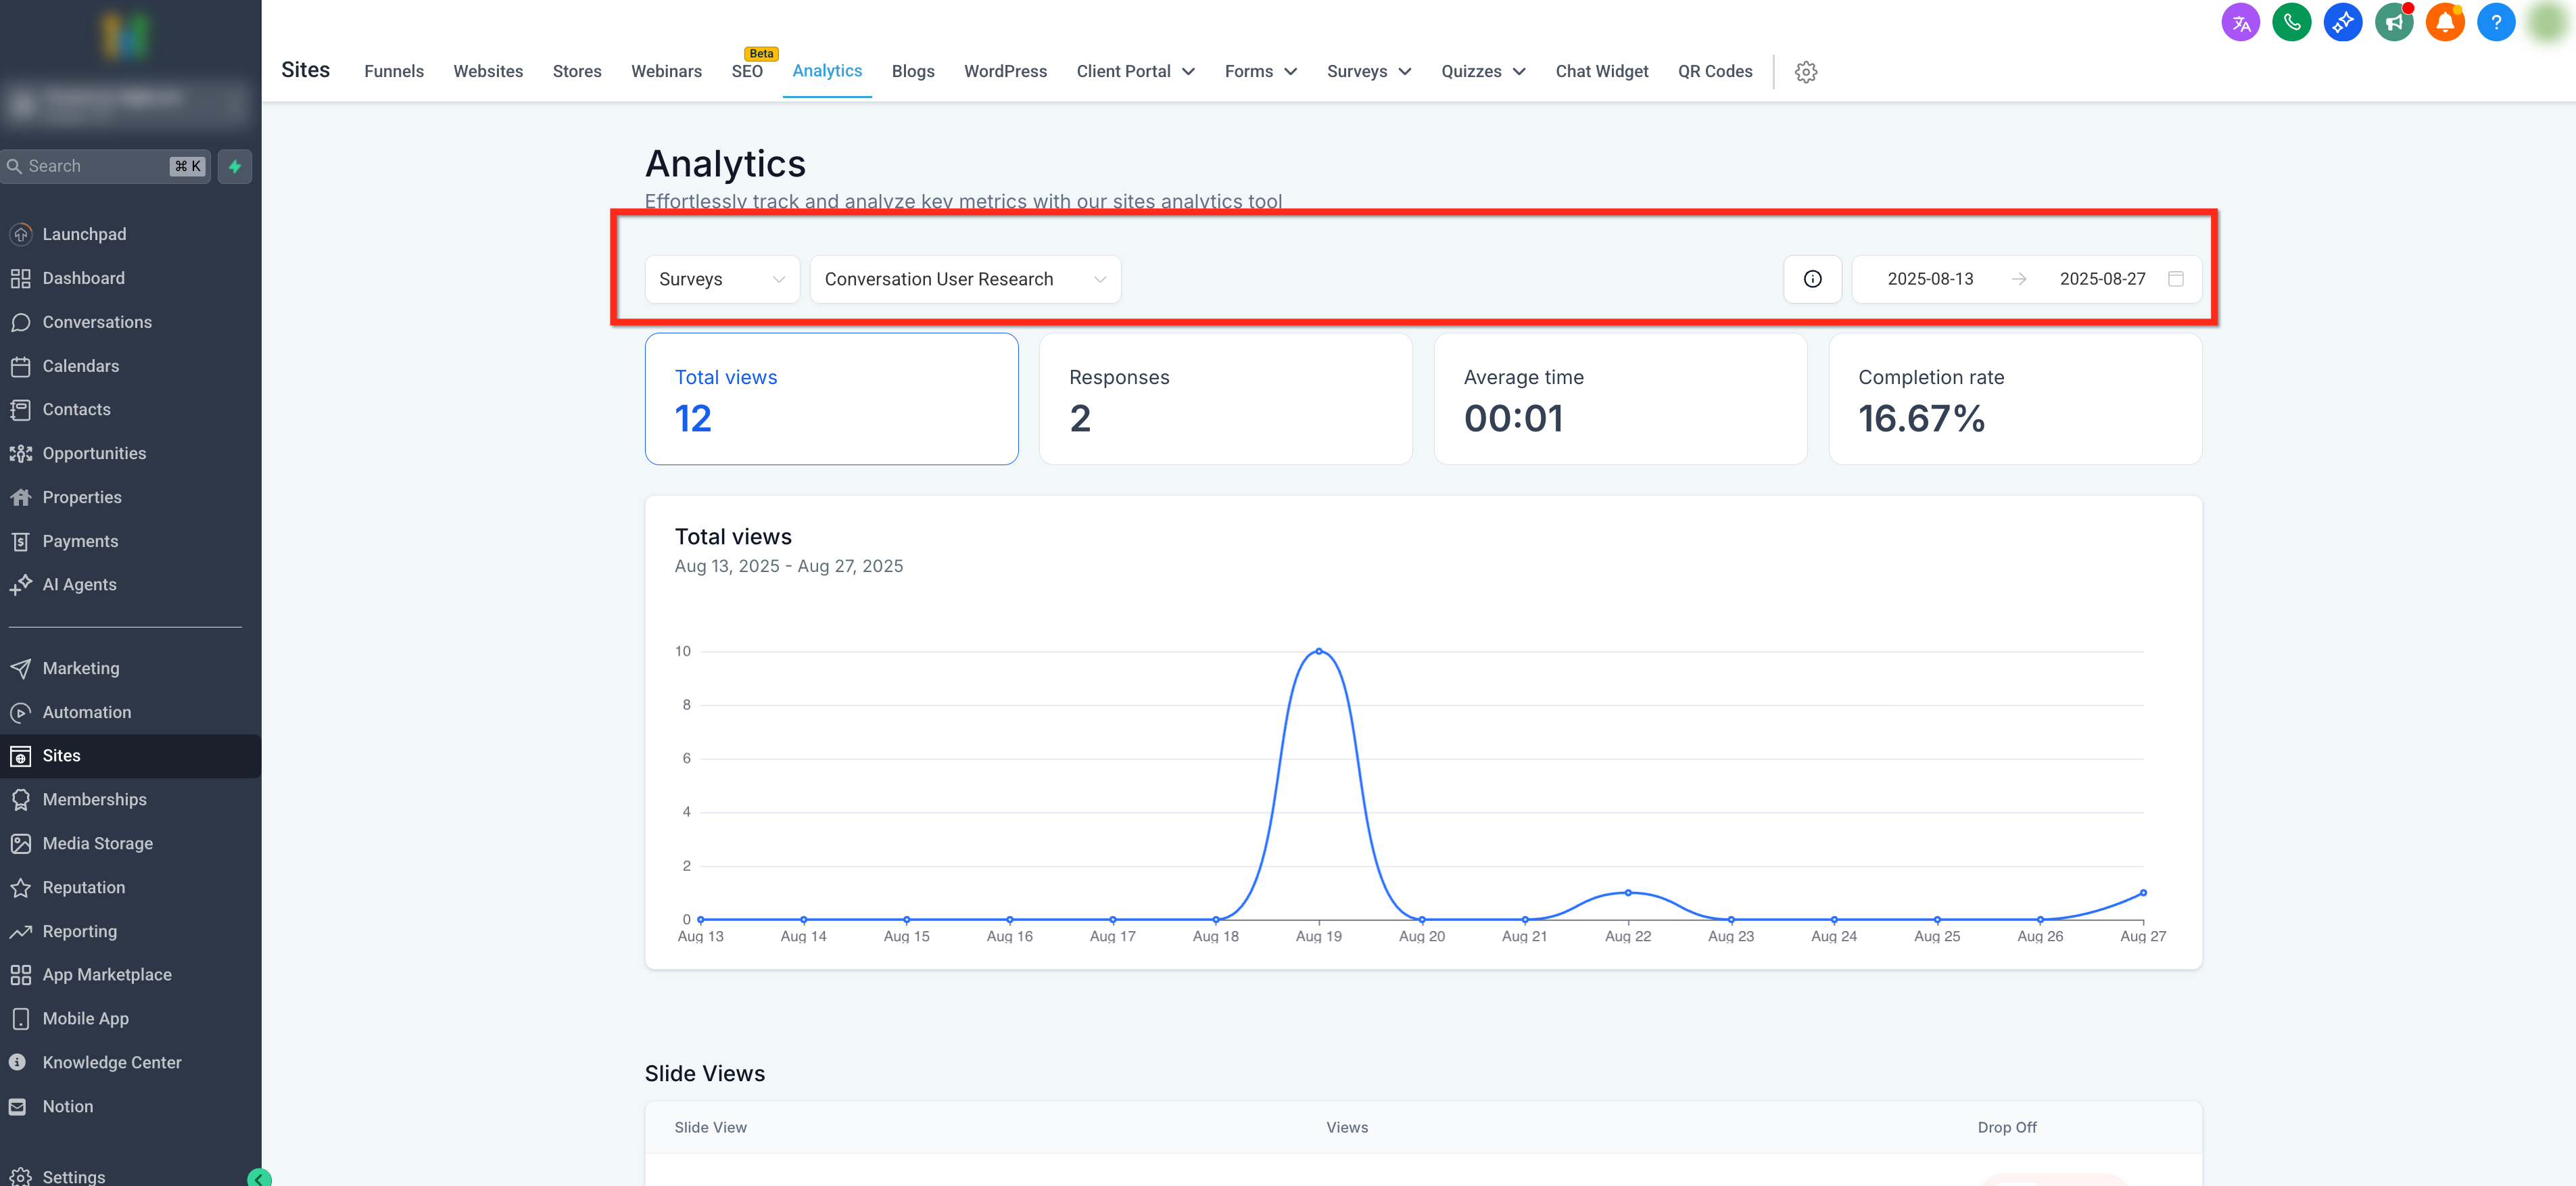
Select Filters: Choose Type (Forms/Surveys), pick an Asset (All or a specific one), and set a Date Range.
Read the Data: Review metric cards, charts, and (for a single survey) the slide‑level table.
Tip: Switch the Asset to a single survey to see per‑slide Views and Drop‑Off.
Survey Slide‑Level Metrics (Views & Drop‑Off)
When a single survey is selected, you’ll see a per‑slide table.
Columns
Slide — step number/title
Views — sessions that reached the slide
Drop‑Off — change vs the previous slide (shown as a count and a %)
How Drop‑Off is calculated
For slide n (where n > 1):
Drop‑Off (count) = Views(n‑1) − Views(n)
Drop‑Off (%) = Drop‑Off(count) ÷ Views(n‑1) × 100
Notes:
Slide 1 has no prior slide → Drop‑Off = N/A
Positive Drop‑Off = fewer people reached the current slide (a drop)
Negative Drop‑Off = more people reached the current slide (a gain)
Why Drop‑Off can be negative
Negative values mean the current slide had more views than the previous slide. Common causes:
Jump/skip logic routes respondents past the previous slide
Legacy “move to slide based on option” (radio/checkbox) skips slides
Slide re‑ordering after data collection changes which slide counts as “previous”
Quick example
Slide 1: 100 views
Slide 2: 93 views → Drop‑Off = 100 − 93 = 7 (7%)
Slide 3: 98 views (5 jumped from 1 → 3) → Drop‑Off = 93 − 98 = ‑5 (‑5.4%)
Troubleshooting Checklist for Negative Drop‑Off
Check conditional logic: Did you use jump/skip rules that route to this slide?
Check for legacy routing: Using the older “move to slide based on radio/checkbox option” can skip slides.
Check slide order changes: Did you reorder slides during the selected date range?
Align dates: If you changed logic or slide order recently, ensure your date filter matches the timeframe you want to analyze.
Frequently Asked Questions
Q: How is the “previous period” comparison determined?
It compares your selected date range to the immediately preceding, equal-length period (e.g., Last 14 days vs the prior 14 days).
Q: Why is the per-form/survey breakdown missing?
The per-form/survey breakdown appears only when viewing All forms/surveys. Selecting a single asset hides the aggregate breakdown.
Q: I selected a survey but don’t see the per-slide analysis table. Why?
The slide analysis appears only when a single, specific survey is selected. If you’re on All surveys, switch the asset selector to the exact survey to view Slide, Views, Drop-off, and Drop-off rate.
Q: What analytics types can I choose in the top-left dropdown?
You can select Forms or Surveys. The dropdown also includes other types (funnels, websites, QR codes, blogs)
Q: The table says “Drop‑Off,” but I see negative numbers. What does that mean?
Negative Drop‑Off means the current slide had more views than the previous slide (a net gain). This often happens with jump/skip logic, legacy “move to slide based on option,” or after reordering slides.
Q: Why don’t I see the slide table?
The slide table appears only when a single survey is selected. Switch the Asset filter from All surveys to a specific survey.